Landing Pages Report Explained
Page Analysis Reports are used to understand the performance of specific pages on your website, and how they influence conversions across your website.
The 'Landing Pages' report looks at inbound traffic (i.e. page entries only) to each page. This is designed to measure if users interact with the first content that they see once landing on your website. If content is misaligned to what they expected, or doesn't match up to the marketing campaign they just clicked on, you will see lower engagement and conversion rates.
What is the difference between this report and the 'All Pages' report?
The 'Landing Pages' report looks at where users start their journeys, and will only include page entry traffic to each page. This report looks at inbound / marketing traffic, and how users interact once they land on the page. Low performing landing pages are often because of a misaligned campaign or channel, with the content on your landing page.
Choose the 'All Pages' report when wanting to know how content/pages influence conversions. Choose the 'Landing Pages' report when wanting to improve landing page and marketing performance.
Understanding Page Engagement Metrics
The table lists each landing page along with key engagement and revenue metrics. Columns include:
- Sessions - The number of sessions in which the page appeared.
- Click Rate % - The percentage of pageviews that had at least one click.
- Median Scroll Depth % - The median percentage of content scrolled and viewed.
- Median Duration - The median time spent on this page from start to finish.
- Conversion % - Percentage of landing‑page sessions that converted (e.g., completed a purchase).
- Revenue $ - Total revenue from sessions that started on this page.
- Avg Conversion Revenue $ - Average revenue per converting session from the specified page

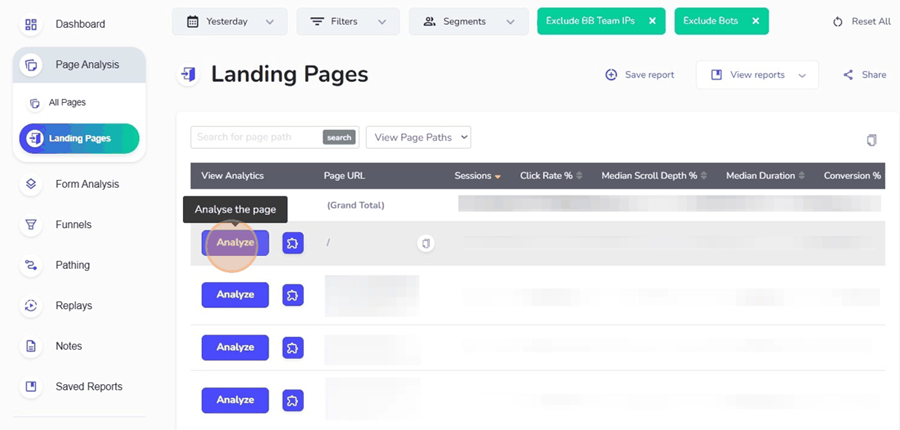
Click 'Analyze' to Open Page Heatmaps/ Clickmaps
Click 'Analyze' to open up an example of any page, and to see visual reports (clickmaps, heatmaps and more) overlaid on that page.
Opening alternate versions of pages - Insightech captures each page and version seen by your website visitors. To open old versions of a page, or another device type (e.g. Mobile), simply apply those rules in the Filters & Segments to update the page examples in your list.
For a detailed walkthrough on creating and using segments, see our Filters & Segments article.
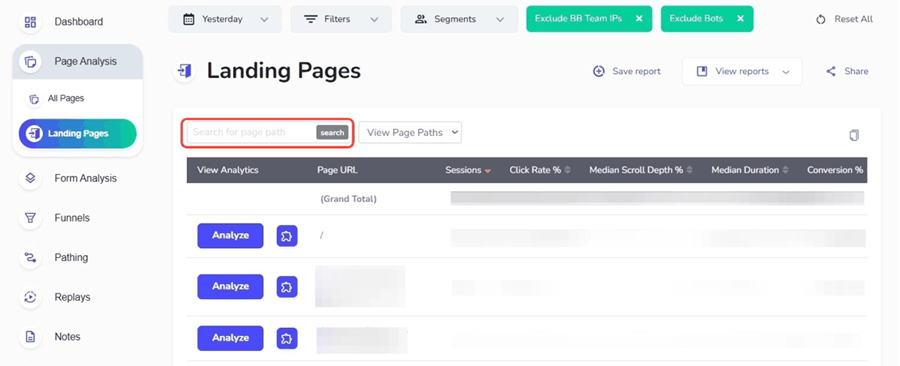
Filter for Specific Pages
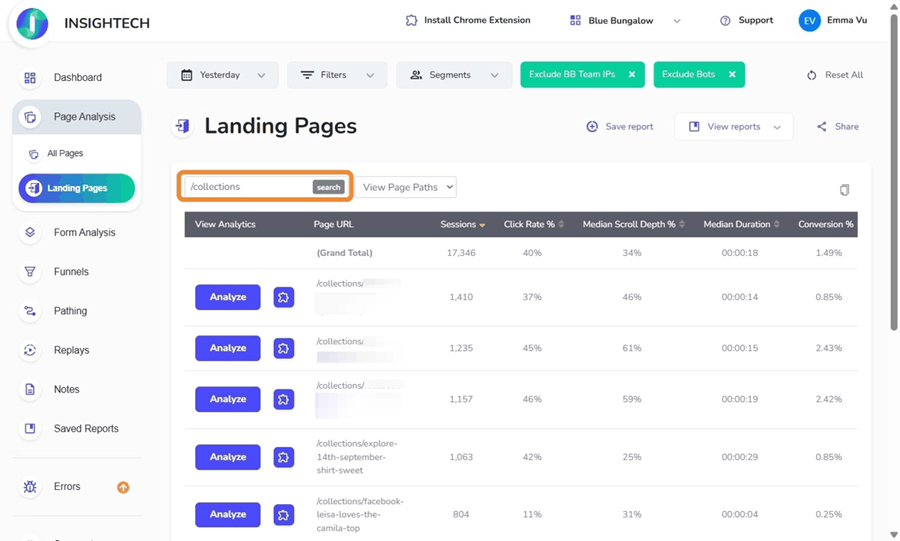
To filter your list of pages to show specific pages, simply type in a unique part of the page URL that you want to search for within the Search for page path bar and click search. Only pages matching that pattern you have typed will be shown.
This is an easy way to find specific pages in the pages list.
Filters are a good way of grouping pages together to compare their performance against each other. When your list updates, you will see summary metrics at the top of your list, which you can benchmark each page against. You can then click 'Analyze' to look at heatmaps / clickmaps of low-performing pages to see what can be improved.
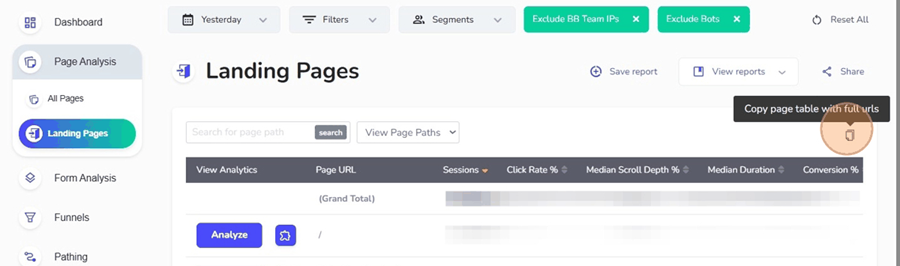
Copying Data to a Spreadsheet
A copy icon appears in the top right corner of the table. Clicking it copies the current table (including all visible rows) to your clipboard for easy pasting into a spreadsheet application.
A confirmation message will indicate that the page list data has been successfully copied.
Saving and Viewing Reports
To keep a custom dashboard view, click Save report and give it a name. To reopen it later, use the View reports menu on any page or visit the Saved Reports page in the left-hand navigation.
For full instructions on naming, sharing and managing saved views, see our Saved Reports article.