Insightech Platform Walkthrough
Now that you have completed the initial setup and how Insightech works, this section covers the key features found on Insightech. Below you will find how to navigate through these reports and understand their capabilities for analysing your website's performance.
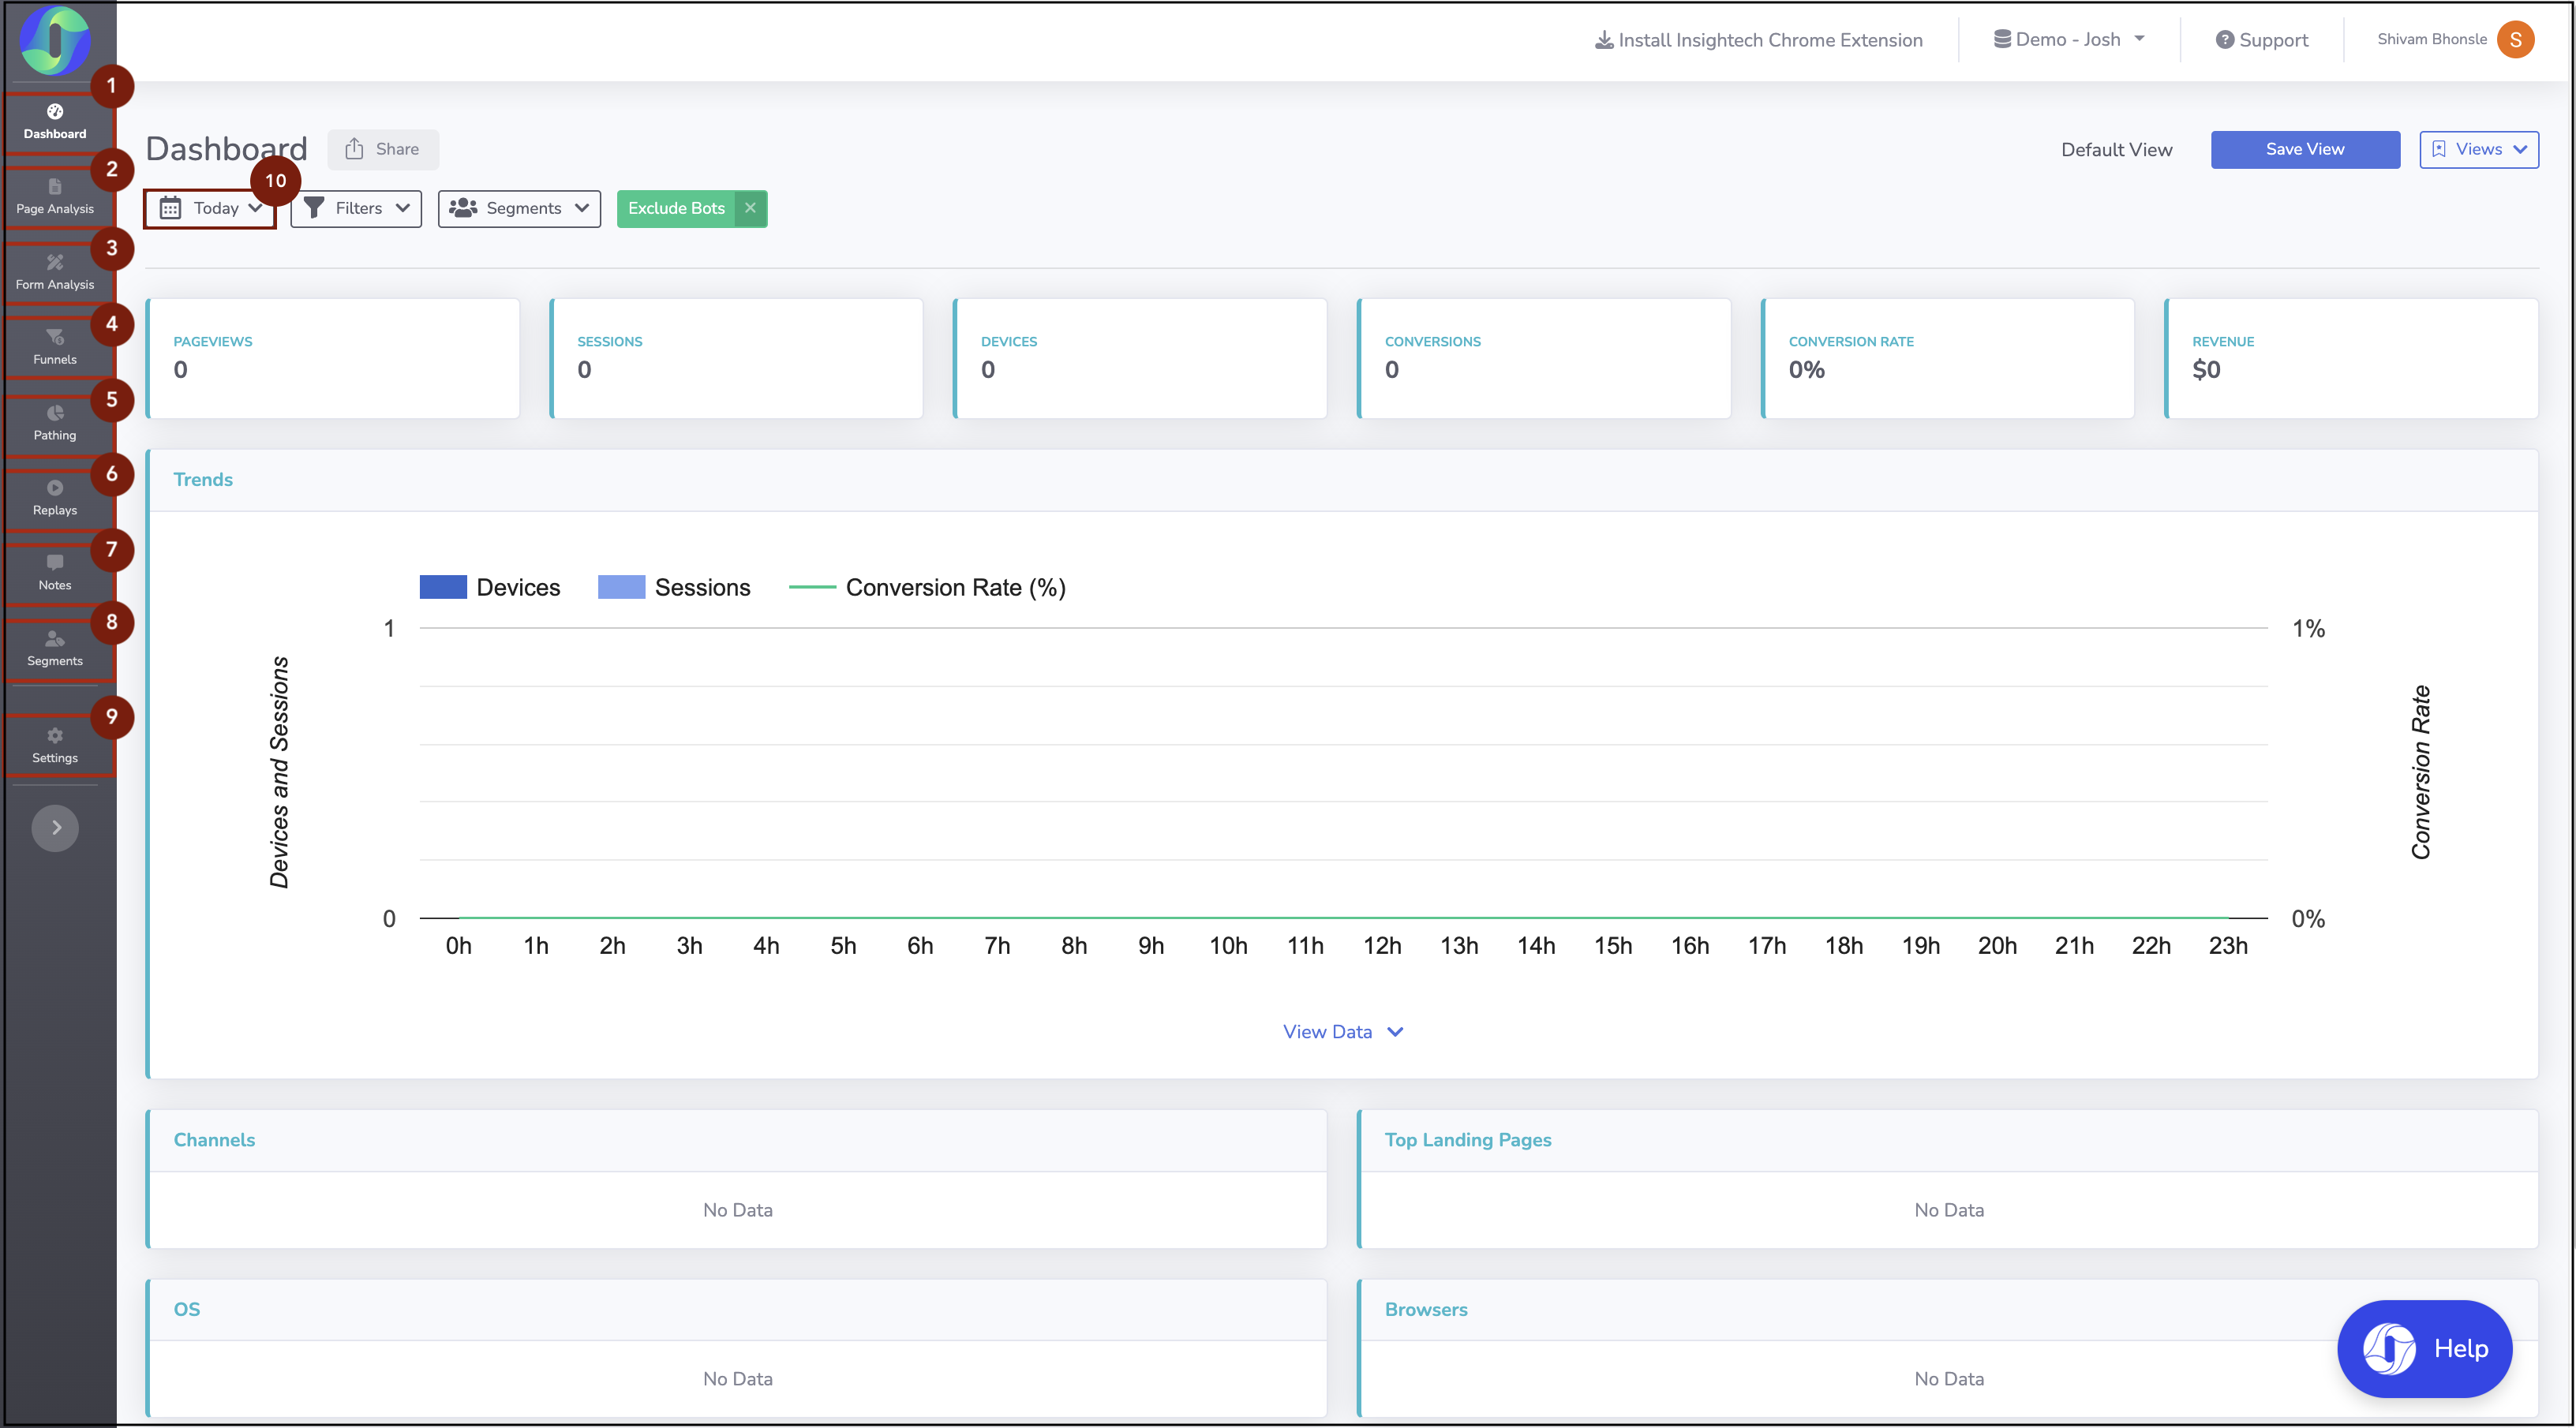
Key Navigation Features on the Insightech Platform
- Dashboard - Monitor high-level health metrics and statistics on your website performance so you can understand what has changed on your website, or with a custom audience segment applied, what is unique about users you want to understand better.
- Page Analysis - Select any URL to generate a session replay so you can apply visual analytics reports (click maps, scrolling heat maps, form analysis) to generate key metrics and a deeper understanding of how users behave across your website.
- Form Analysis - Use form analysis to understand the current behaviour and drop-out rate of users across key forms (checkout, sign-up and newsletter etc.) on your website so you can make actionable changes to improve their engagement.
- Funnels - Understand high-level metrics and in-depth customer journey statistics (potential drop-offs & conversion rate etc.) through an editor for you to create new conversion funnels. You can view where customers are stuck and identify exactly where they drop off so you can improve their web experience.
- Pathing Reports - Map out the most common paths taken by users through your website until they convert into customers. Understand the behaviours of inbound traffic and differences in conversion paths to identify how users submit customer support issues.
- Replays - Select any replay and Insightech will generate a fully retroactive visual journey for you to track customer behaviour. Apply visual analytics reports for an interactive recreation of your customer journey to identify drop-off points that customers may encounter and opportunities to improve their website experience.
- Notes - Bookmark a moment of interest in any replay or across any analytics report so you can easily share these insights with your team to collaborate on your website's analysis.
- Segments - Use the segment panel to create and edit existing segments for different audiences on your website. This panel provides a list of all segments and filters created on your profile.
- Settings (Admin Only) - Use this panel to access your profile, users, tracking code and conversion settings
- Date Range - Change the date ranges across the Insightech platform.
- Please Note - Once a date range is applied, this data will be reflected across most of the reports found on the platform.
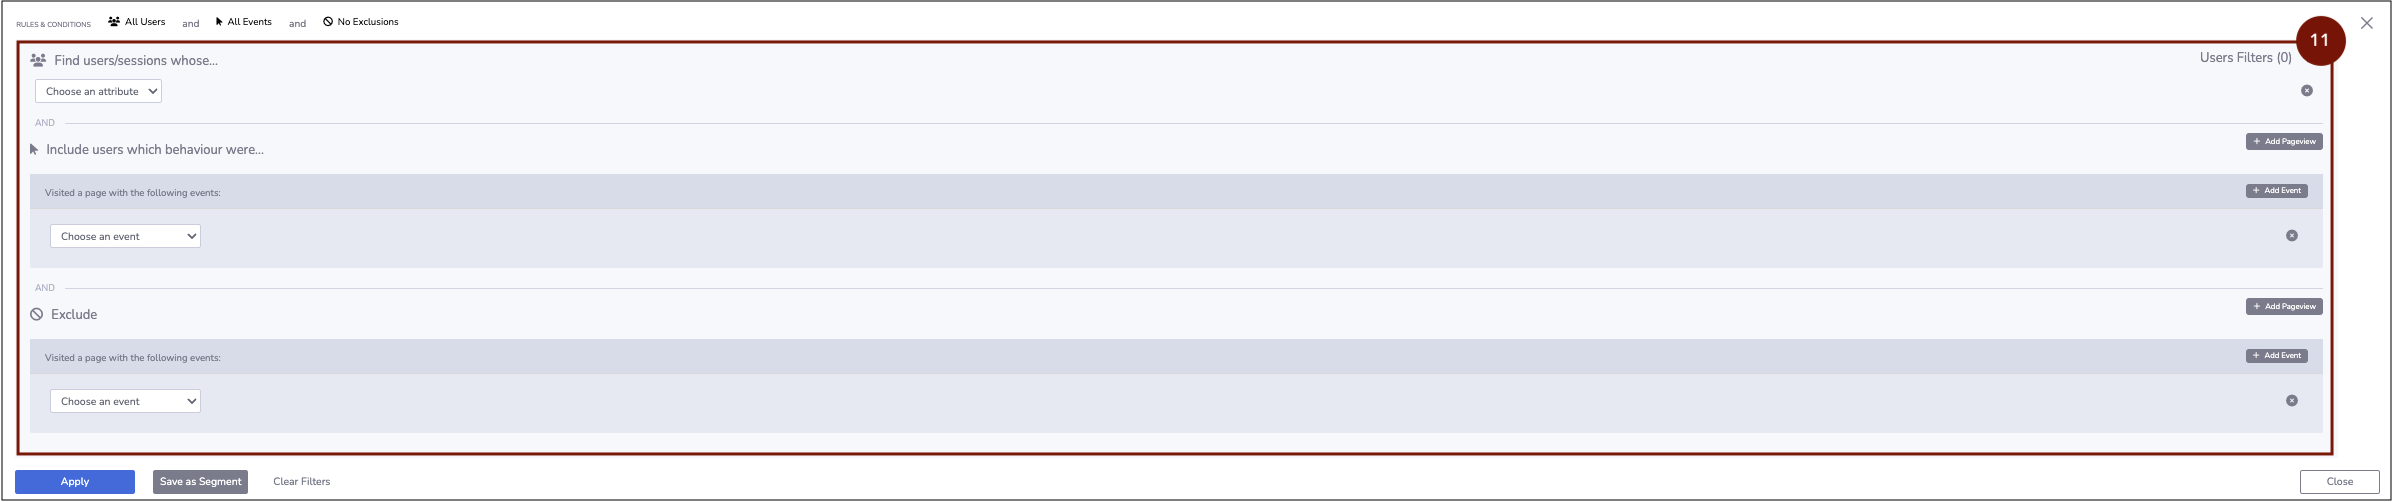
- Segments & Filters - Create new filters, save these as segments and conduct a free text search across your website using this section. Use segments to compare engagement and metrics across different audiences on your website with real-time data.
- Please Note - Once a segment is applied, data that is shown will be reflected across most reports on the platform.
Now that you know how to navigate around the platform, let's go through the key use cases to help you improve your customer experiences. Click here to learn more about these key use-cases
Quick Overview of Insightech Platform
Below is a quick walk through of Insightech's key capabilities such as click maps, behavioural tracking, and page-level performance comparisons that reveal top-clicked elements and user interaction patterns.