Click Map Reports visualise where users interact with your page by overlaying aggregated click data on top of a session replay. You can watch an anonymised replay of a real user session—pausing, rewinding and interacting with the page just as they did—and then open a click map to see which elements and links attract the most attention. Because click maps sit on top of session replays, we recommend readingWhat are Session Replays?first.
You can also view click maps directly on your live website using the Insightech Chrome Extension; see Set Up the Insightech Chrome Extension for details.
How to Access Click Maps
There are two main ways to open a click map:
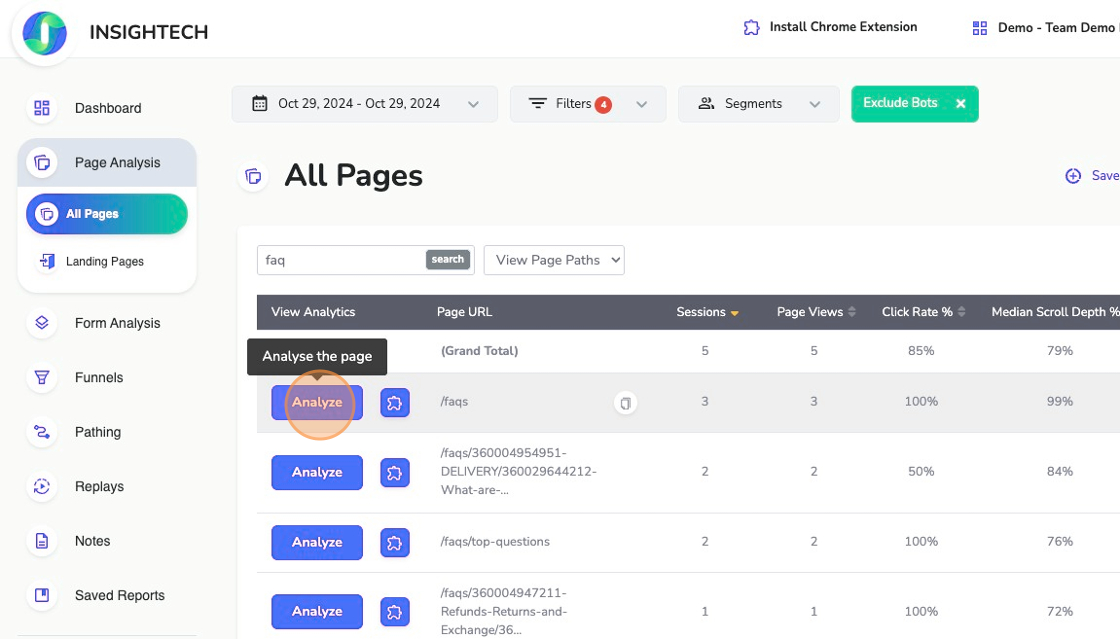
From thePage Analysis Reports: In the All Pages or Landing Pages report, click a page row to open a sample session replay. Pause the replay and select Analytics → Clickmap to view clicks on that page.
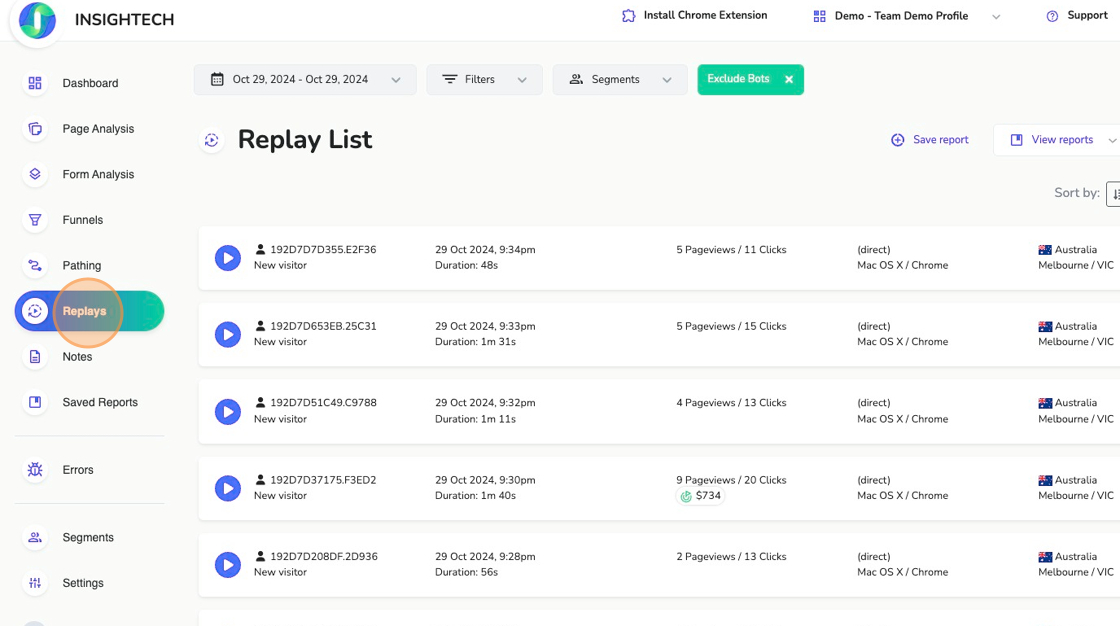
FromSession replays: Open up any Session Replay in the replays list, and then click the Analyticstab --> Clickmap.The clickmap will overlay data on the content you are currently viewing, and you will see a list of top clicked elements in the right hand tab.
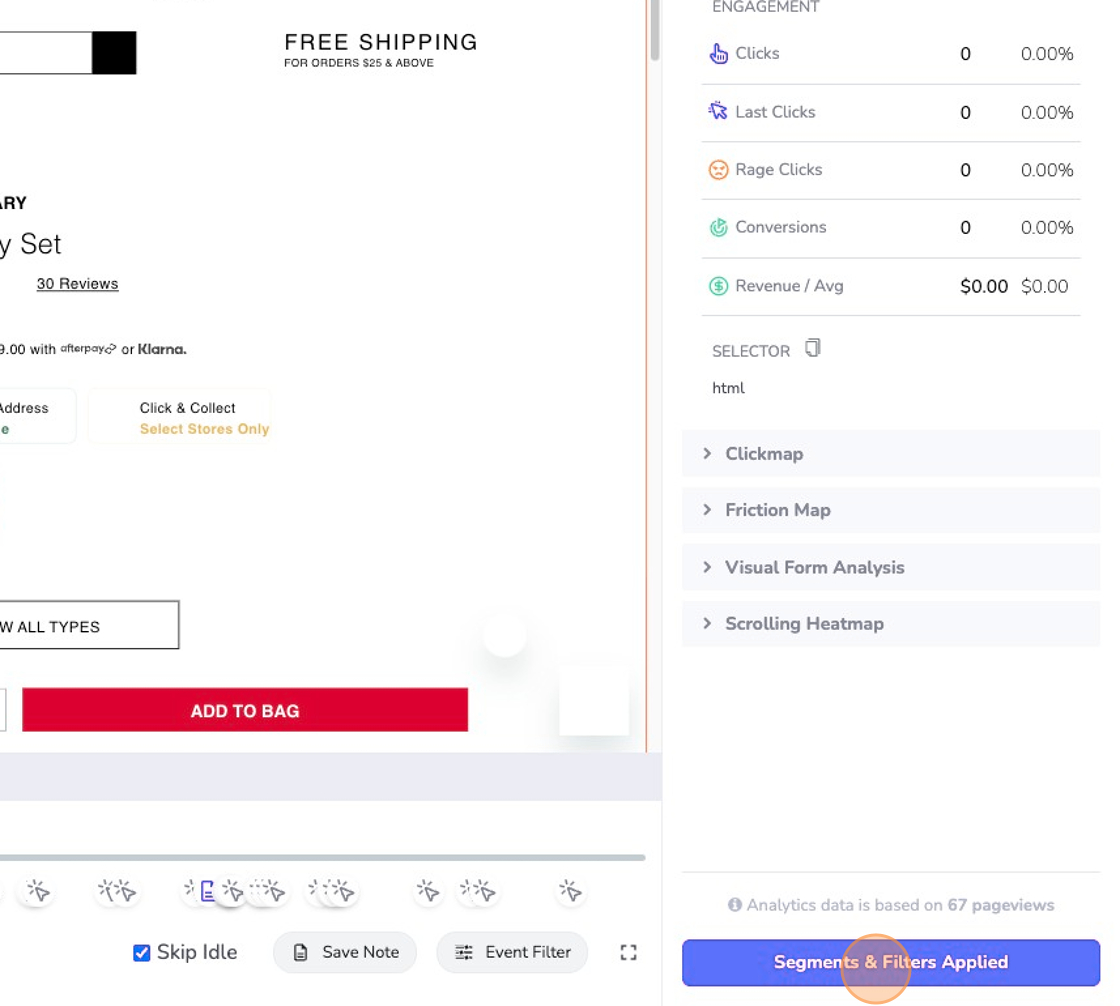
Understanding the Analytics tab
The Analytics tab within a session replay contains several tools for exploring user behaviour:
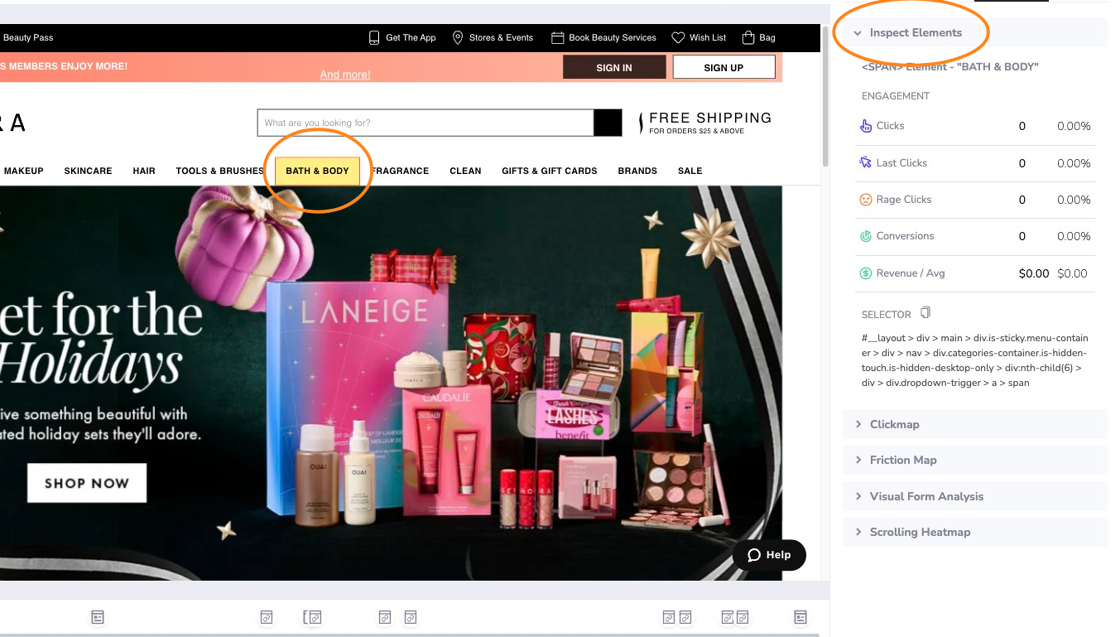
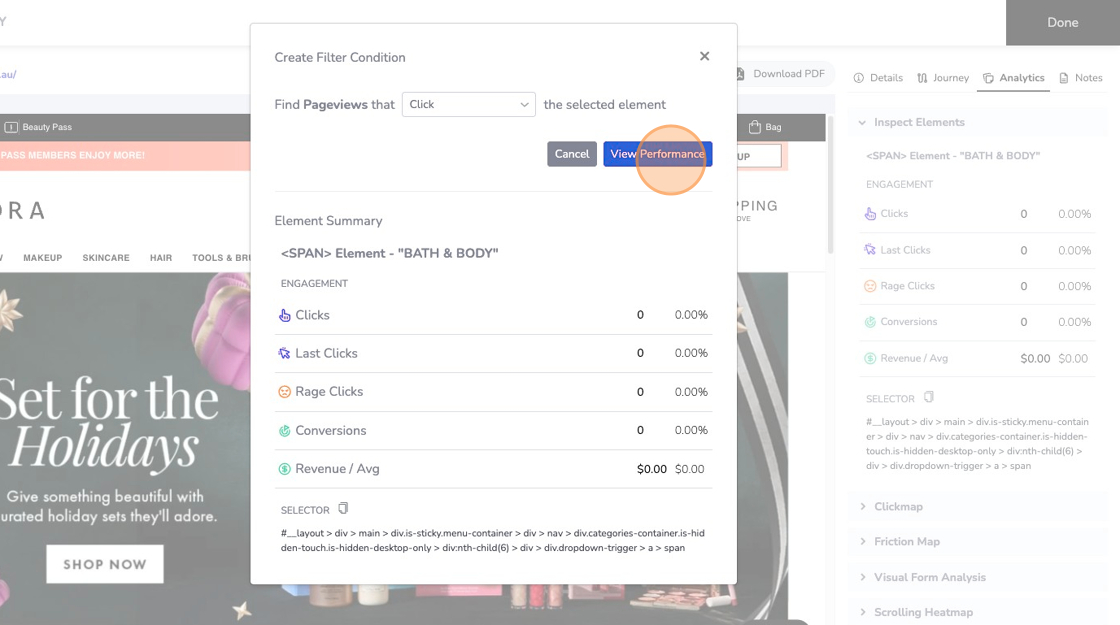
Inspect Elements
Enable this to hover over any element on the page to see a summary of interactions—clicks, last clicks, rage clicks, conversions and revenue.
You can also click on an element to open a pop-up, that will show key information about that element. Select an interaction type, and click View Performance to create a report using the element you just clicked on.
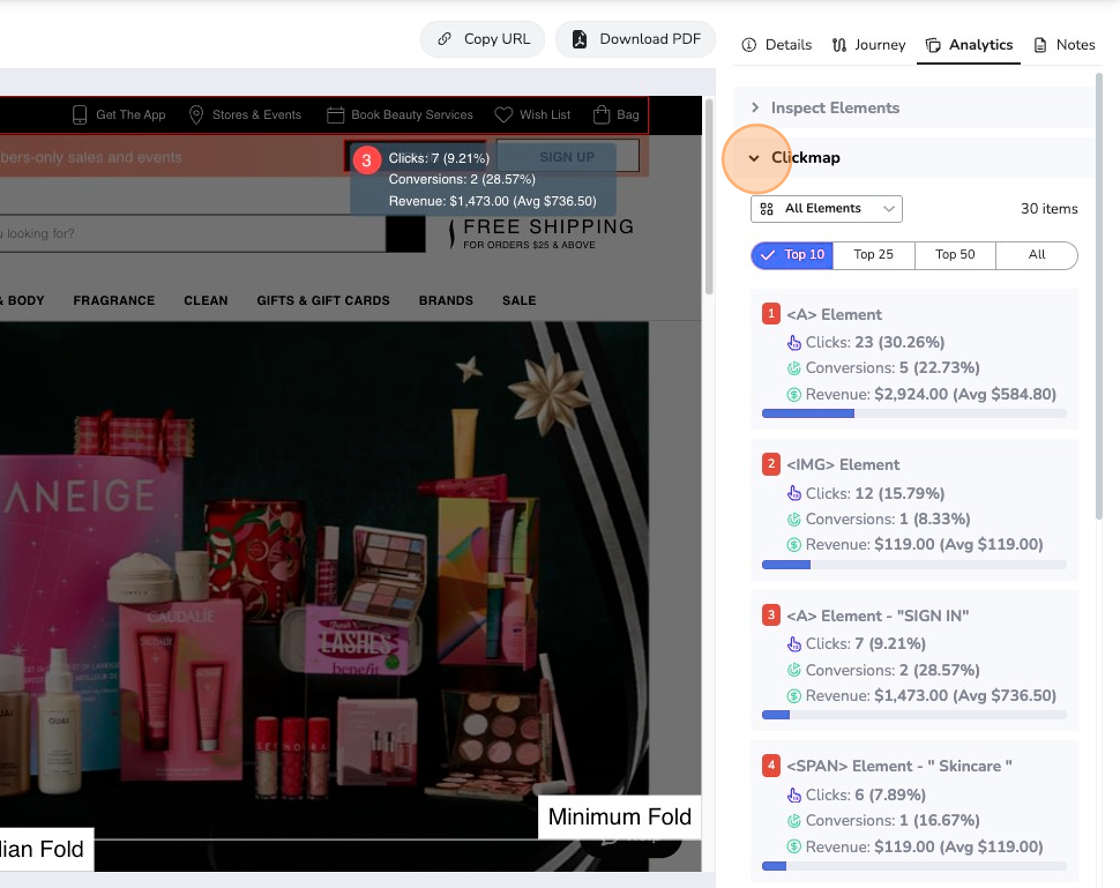
Clickmap
Open this section to overlay a Clickmap of click behaviours for elements currently showing in the Session Replays. The clickmap will rank all of the elements by click volumes.
Select A MetricFor Your Clickmap
All Element Clicks shows clicks on all element types including Search Bars, carousels, and non-linkable content.
Link Clicks only shows clicks on Links to other pages.
Last Element Clicks shows the last clicked elements before a user leaves the page
Top 10, Top 25,Top 50 - Click to reduce the noise and only show 10, 25, or 50 clicks at a time.
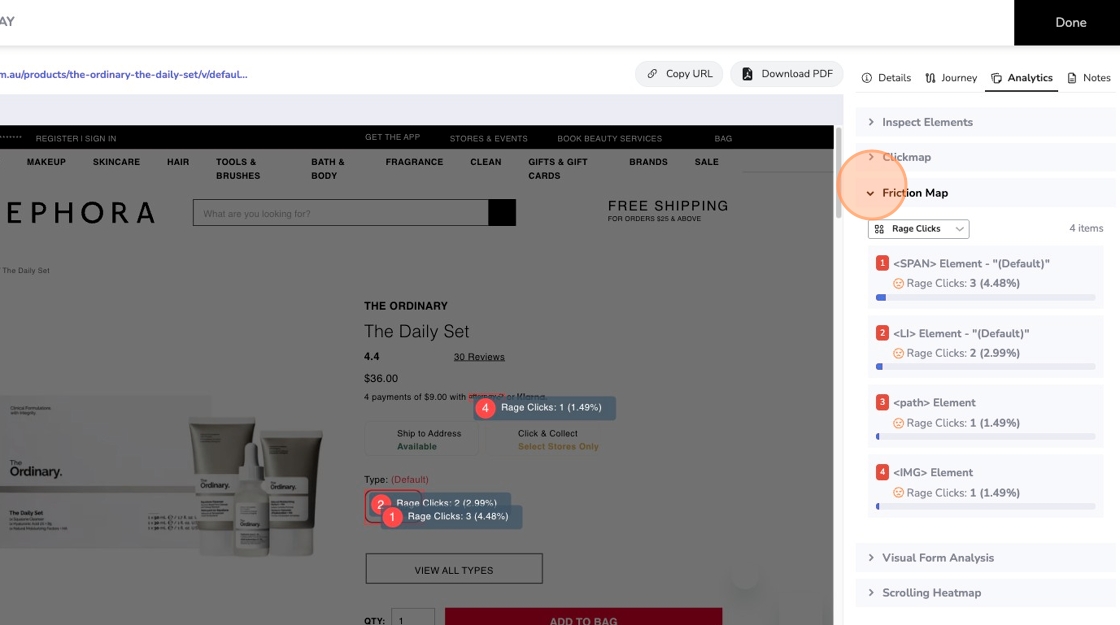
Friction Map
Enable this to see where users are showing signs of frustration. The Rage Clicks report shows which elements have had users clicked repeatedly in rapid succession (in a rage/frustration). Investigate if these elements should be clickable, or should have a different action.
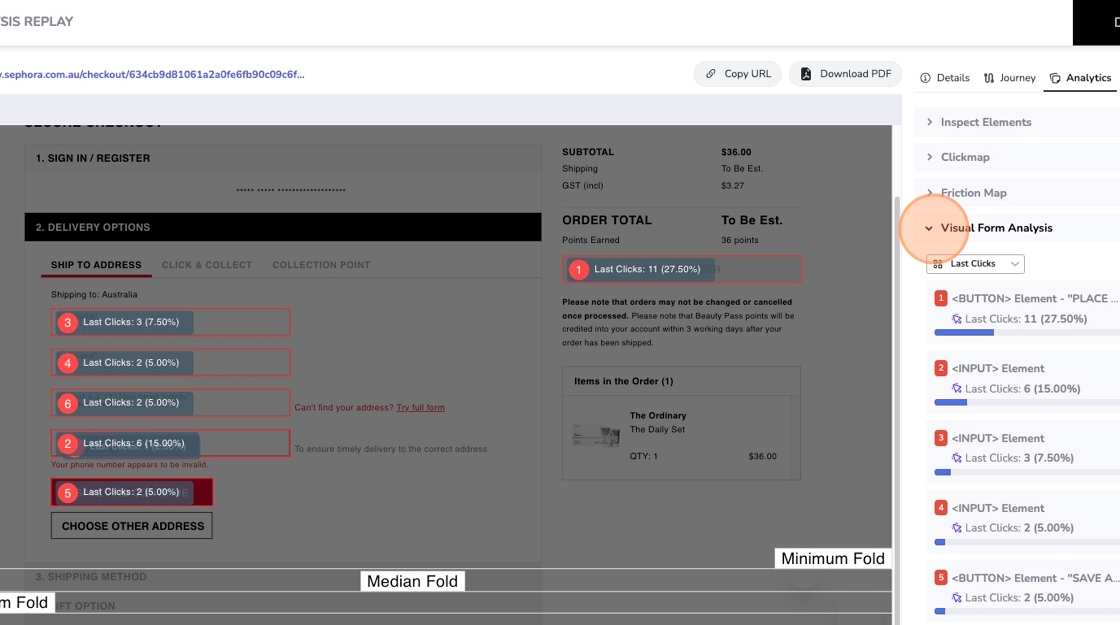
Visual Form Analysis
This report automatically detects form fields and buttons within your forms, for analysis. Most Clicks will show the most interacted fields in your form, and Last Clicks will show at what point users are dropping off (i.e. their last interaction on the form).
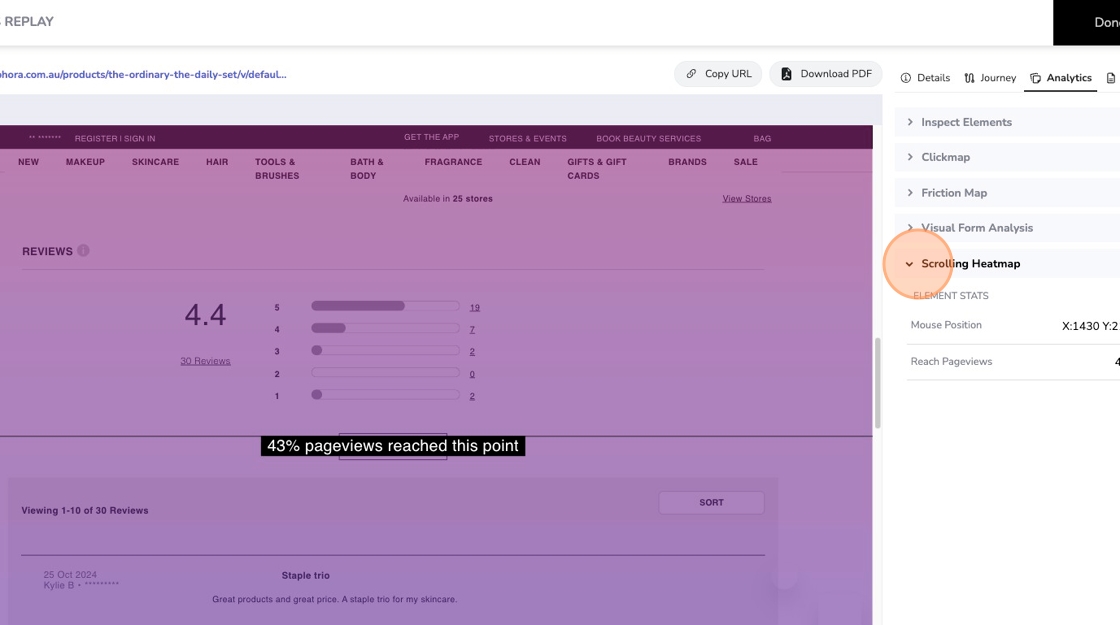
Scrolling Heatmap
Heatmaps overlay on your page to show how much of your page your users are scrolling down to see. As you hover over the page, you will see a marker line indicating the percentage of sessions that see the depth you are hovering at.
Apply Mobile or Desktop segments to see data specific to each device.
It is recommended to look at Mobile and Desktop scroll rates separately. To analyse Mobile, apply a Mobile segment before opening the page for analysis. You will then see a mobile example, and can look at scrolling depths specifically for your mobile devices. Repeat the process for Desktop.
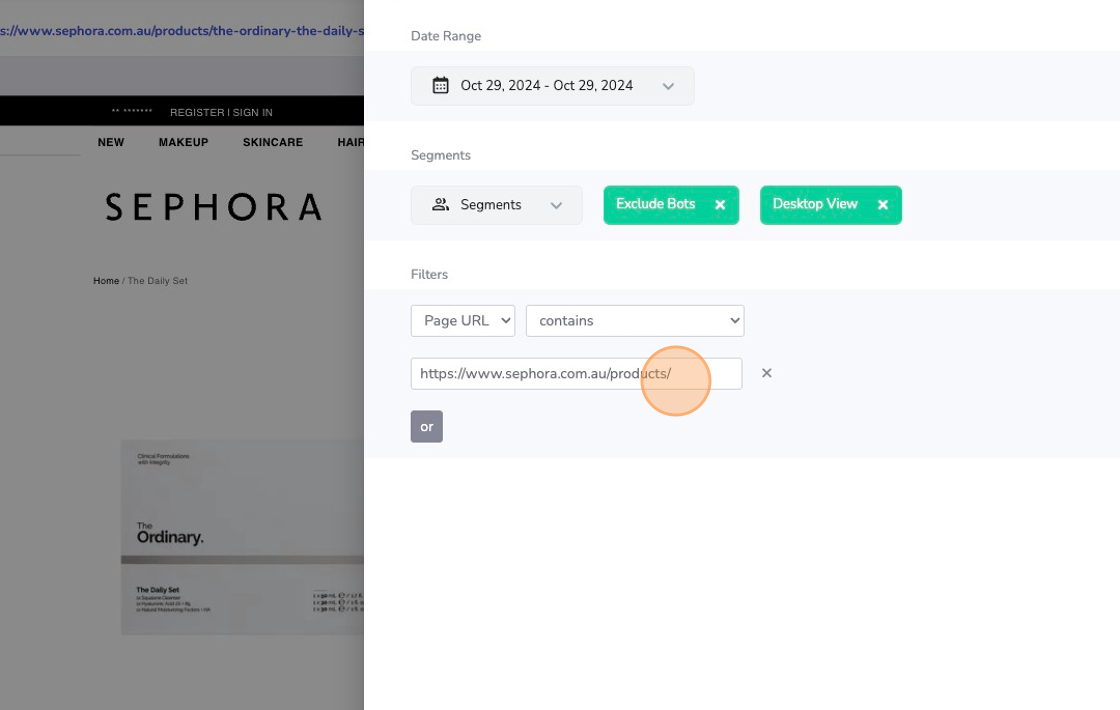
Applying filters and segments In Your Session Replay
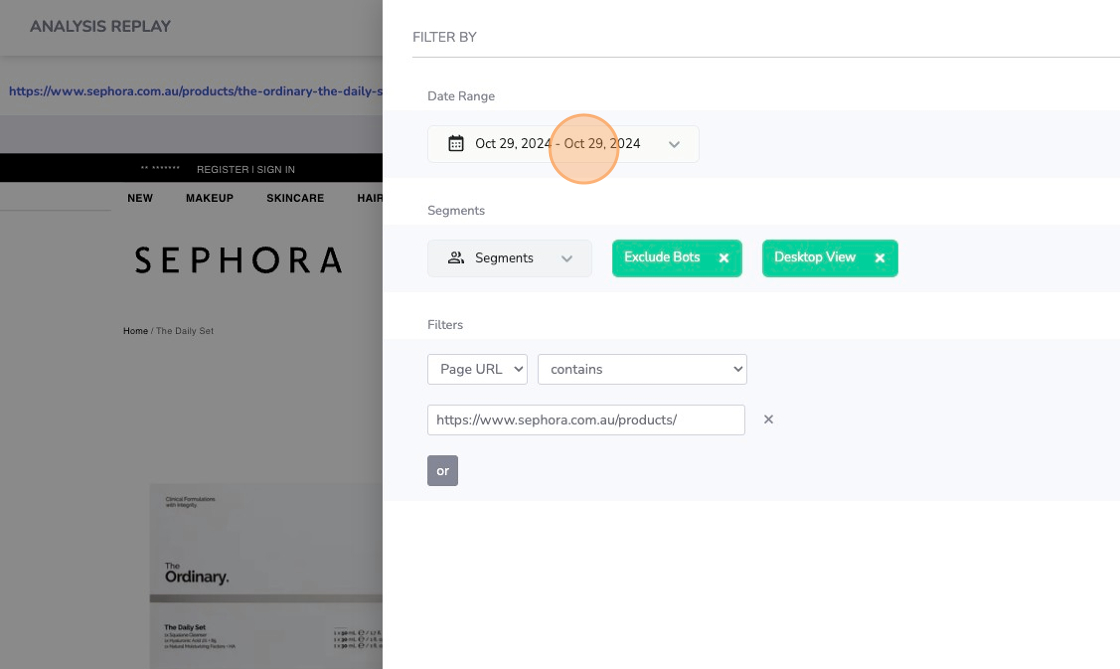
At the bottom of the Analytics panel you’ll see the Segments&Filters button. Click this to open up a panel where you can apply rules to apply new data to the Page / Session Replay we are currently looking at.
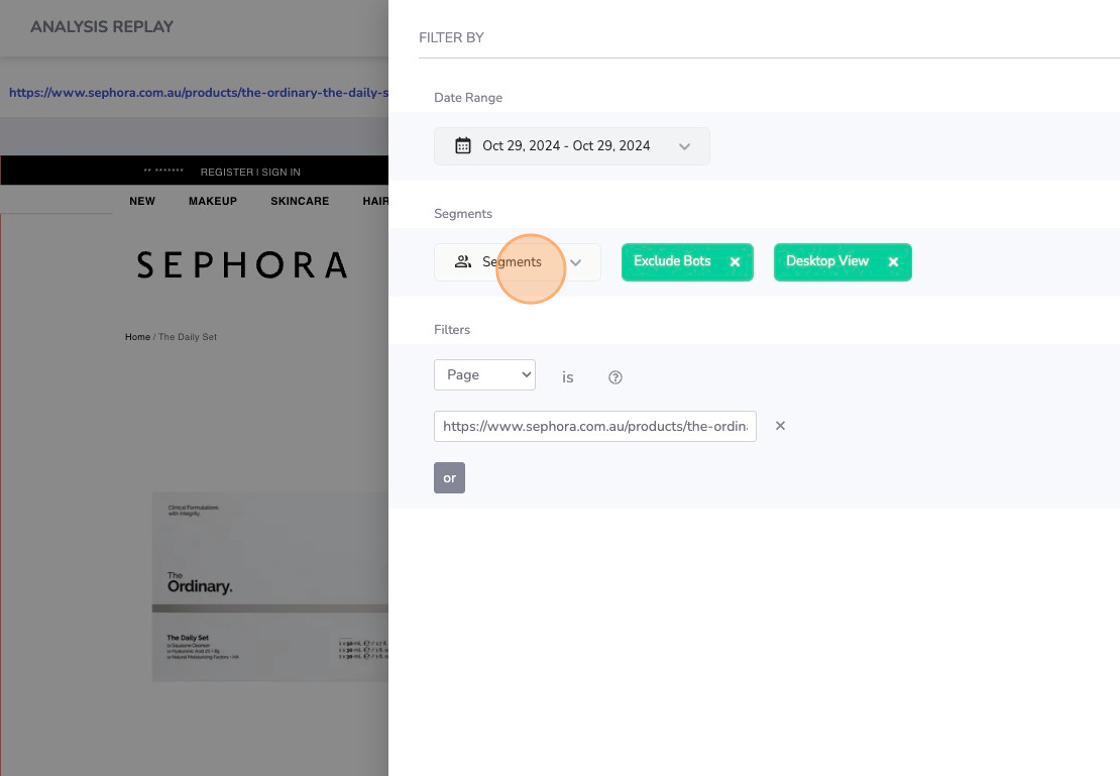
What filters you can apply:
You can select a date range to apply data from. Click the calendar to open up and select a date
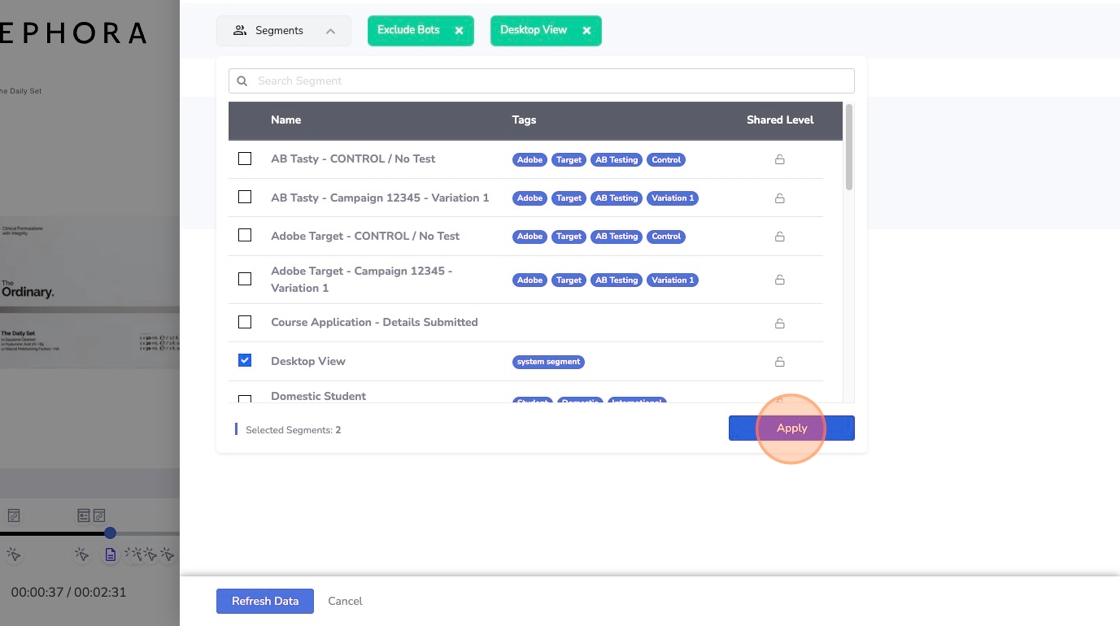
Select Segments to apply from the dropdown. You will see all segments here that you have saved in the platform.Once you have selected your segments, click Apply to have them added to your filters panel.
Group different page URLs together
Once you have applied your filters & segments, Click 'Refresh Data' and Insightech will get your new data and apply it to the page you're currently looking at.
Use this when you want toanalyse different audiences behaviours across each of your pages.