Session Replays are fully interactive recreations of (anonymous) user sessions on your website. You can watch each journey as if you are sitting next to the user as they interact with your digital experiences.
You will also be able to search for specific events in their journey, and overlay visual reports on any of the content you see in the replay, aggregated for all of your users, including Click Maps, Scrolling Heatmaps, Visual Form Analysis and Friction Maps. These will show how users engage with your content, and if it's helping them to convert on your website.
How to Access Session Replays
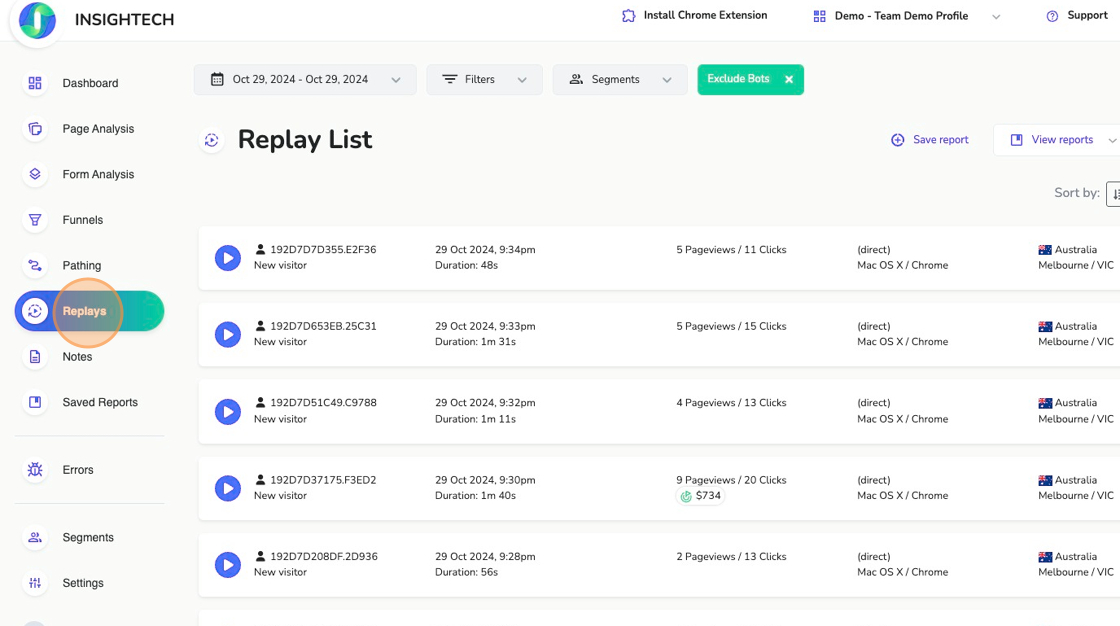
Click 'Replays' in the main navigation to bring up each session replay from your website.You will now see a list of replays along with some key information about them, including what devices they used, if they are a new or returning visitor, or if they have had frustrated moments in their replay.
Segments and filters should be applied to this list to look for specific user journeys/replays. For full instructions on how to use filters and segments, please refer to the Segments & Filters article.
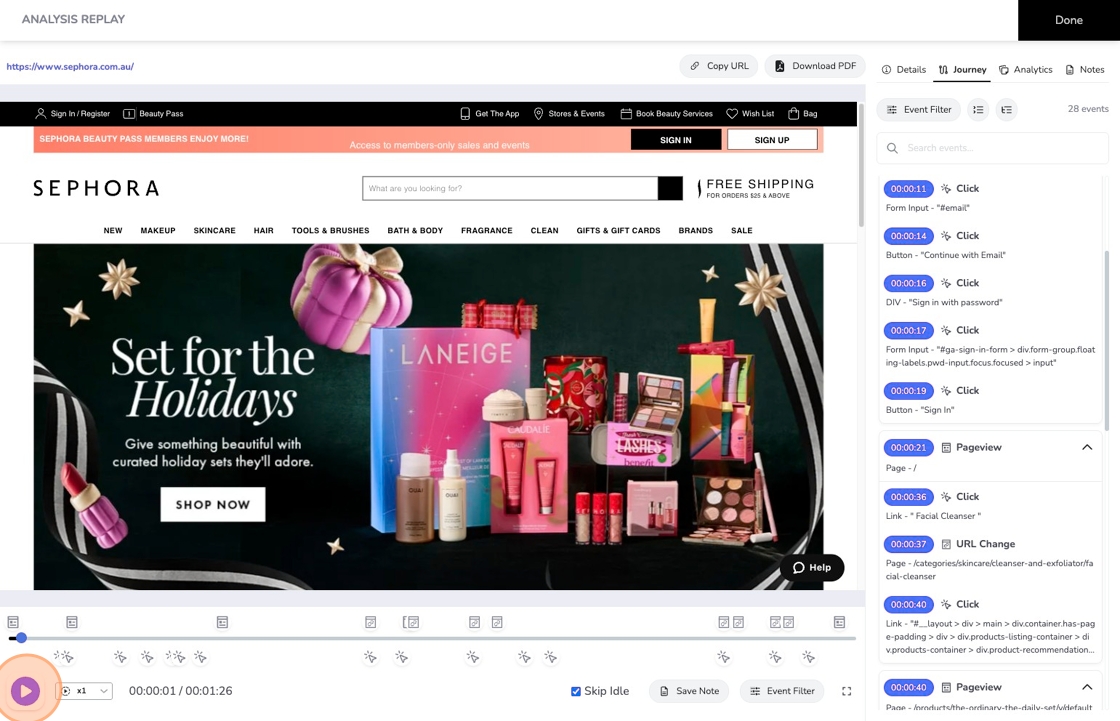
Click the PLAYicon against any replay to bring up that replay example. You will then be shown the full session for that customer's journey through your website.
Why WatchReplays?
Session replays are recreations of the actual pages that the user saw and interacted with. This means you can pause that page and interact with it as if you are sitting next to that user at that point in time (using Inspect Mode).
Press play, or use the replay timeline bar to jump forward or backward in this user's journey. You can also adjust playback speed, and enable Skip Idle to jump past sections of inactivity.
Using the Tabs and Reporting Overlays
On the right side of the Session Replay, you will see four tabs that will show more information about the Session Replay.
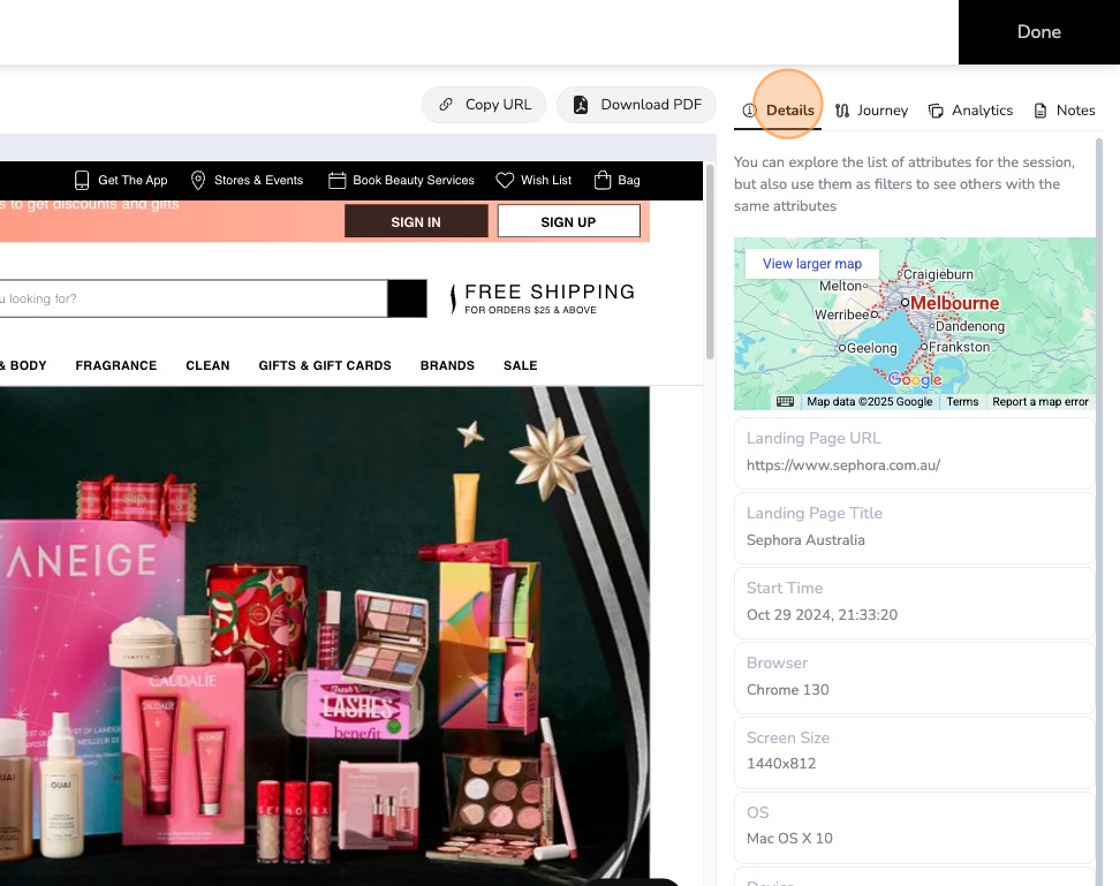
Details – lists all details about thisone session replay, such as what device they are using, their landing page URL and title, start time, browser, screen size and operating system. Click any of these to search for other session replays with the same attributes.
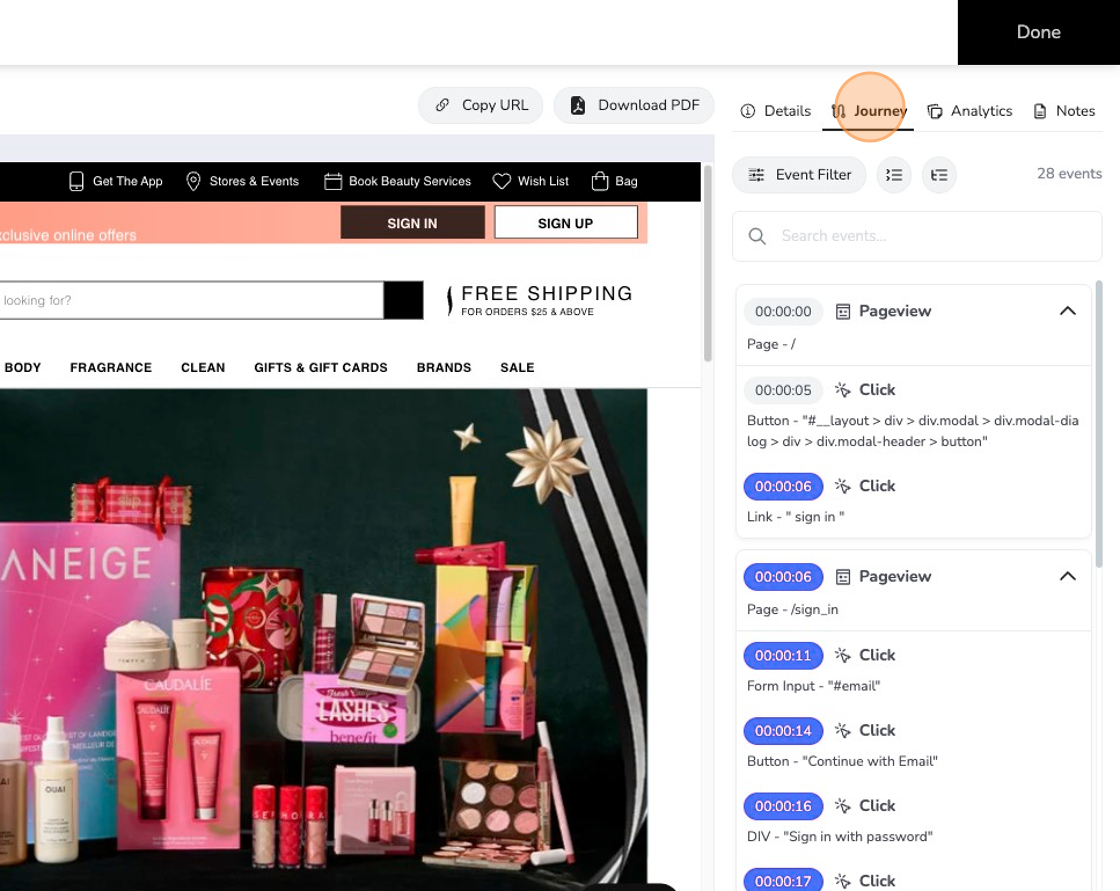
Journey – displays a full list of events that happened during the session (pageviews, clicks, scrolls, datalayer events, etc.) with timestamps. Search for specific events within the replay (e.g. a link clicked, or error message loaded) and click the event in the list to jump to where that event occurred in the session replay.
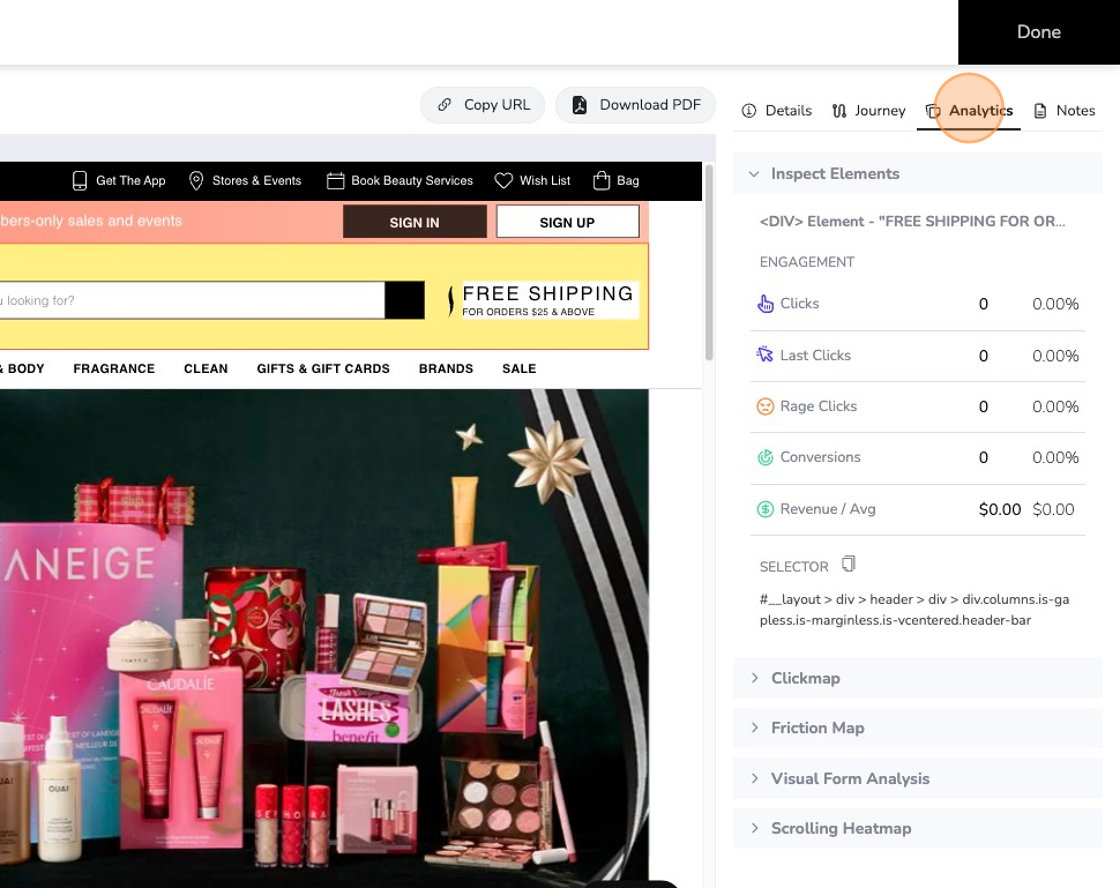
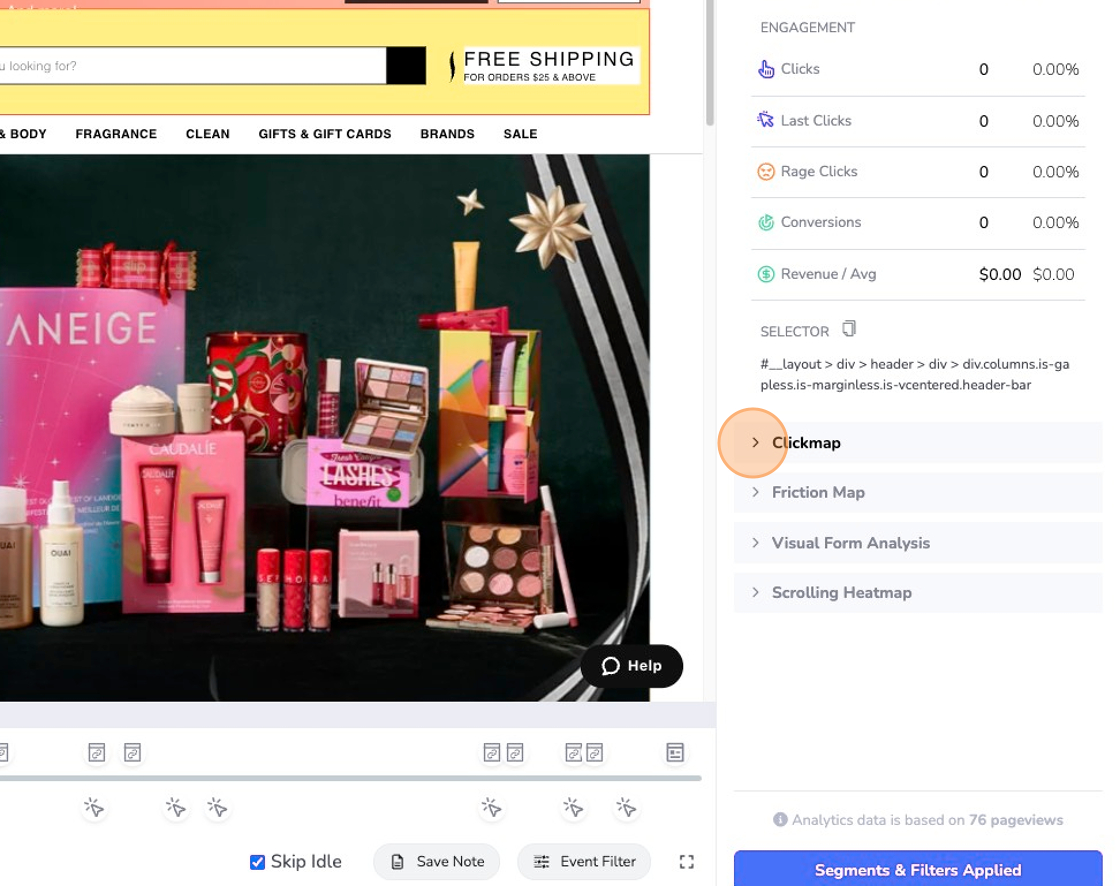
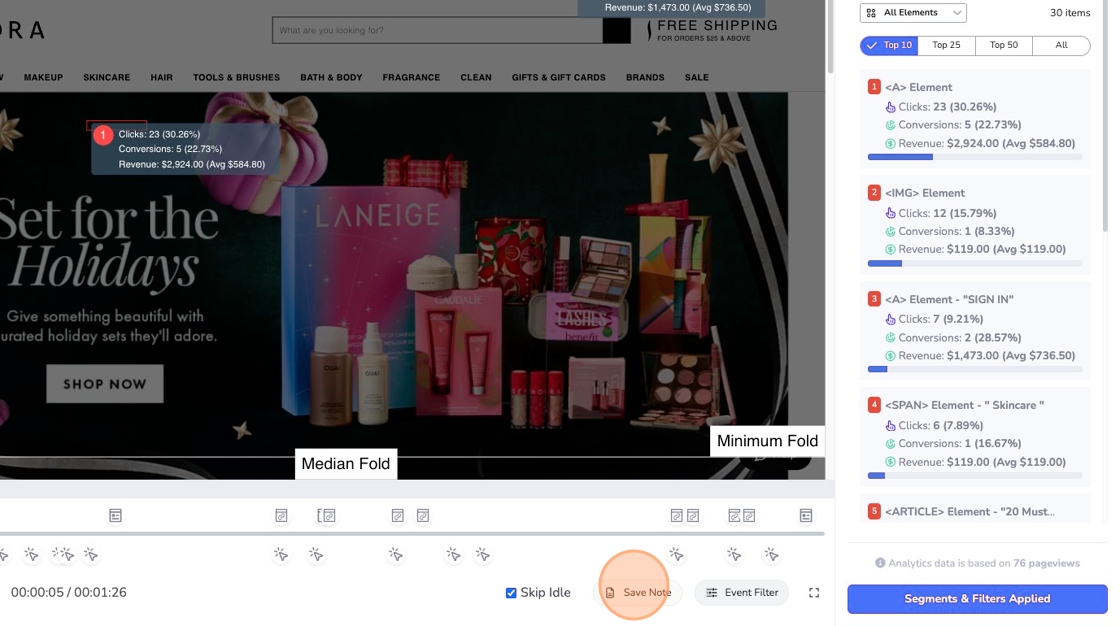
Analytics – Choose from multiple visual reports like Clickmaps, Scrolling Heatmaps, or Form Analysis to overlay on top of the current page you are viewing. This aggregates data from all visitors onto the replay. You can apply segments & filters to change date ranges, or look at specific audiences, channels, etc. Click for more information about Clickmaps.Under the Analytics Tab, you can click on any of the Reporting Drop Downs to overlay that report on the current content you are looking at. Clicking on 'Clickmap' would overlay click data for all users on the existing page content you are looking at.
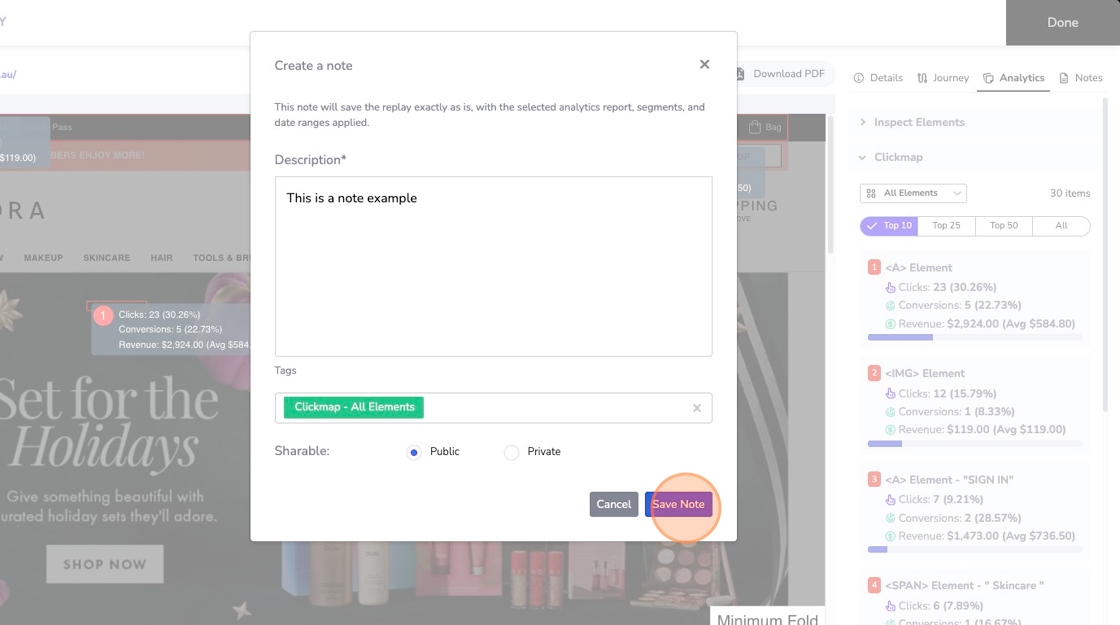
Notes – lets you save the current state of what you're looking at, whether it's a replay moment, a clickmap, or a heatmap, to share with your team as you are currently viewing it. After overlaying any report on the replay that you want to save, click Save Noteon the bottom bar, to bring up a pop up, and save a note.Put in a description for the report you want to save, and click Save Note.Once your note is saved, you will see it in the right hand panel under the Notes Tab and also in the Notes Report (left navigation of Insightech dashboard) where your team can find notes that you have saved. Click here to learn more about Notes.
 Segments and filters should be applied to this list to look for specific user journeys/replays. For full instructions on how to use filters and segments, please refer to the Segments & Filters article.