Insightech Dashboards
The Insightech dashboard enables you to analyze the performance of your overall website, or for key audiences that have visited your website.
Use the dashboard to:
- Monitor high-level metrics and the performance of your website
- Compare different date ranges
- Compare the impact of features and audiences
Insightech's interactive dashboard also allows you to click and filter the dashboard around key data points.
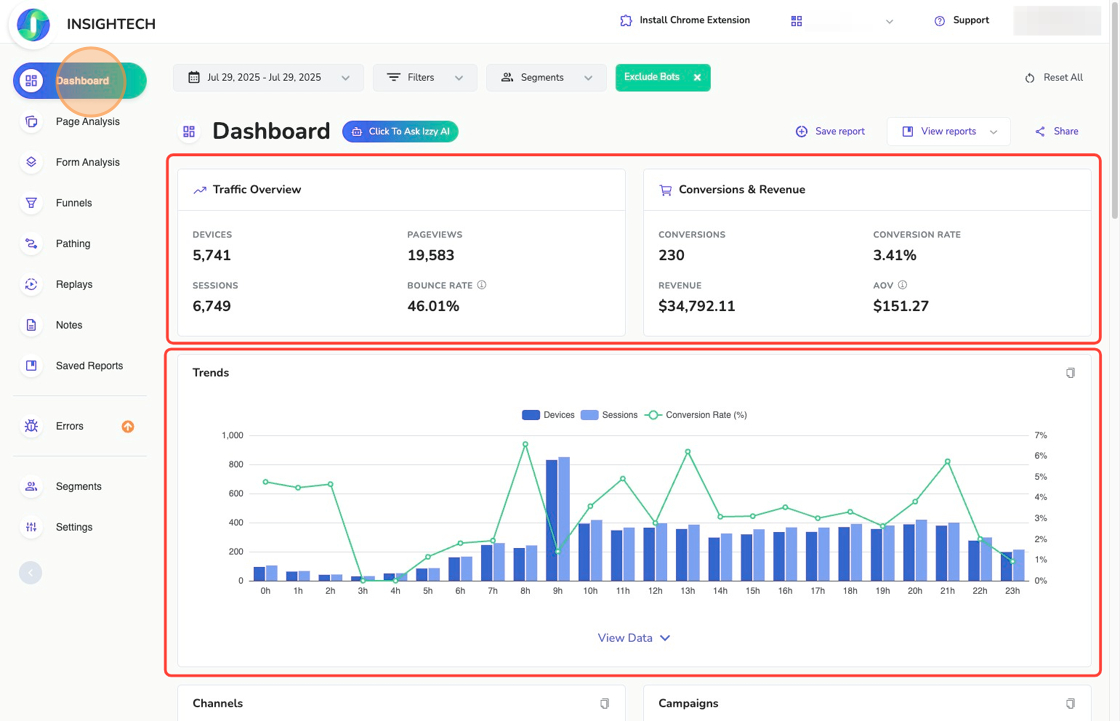
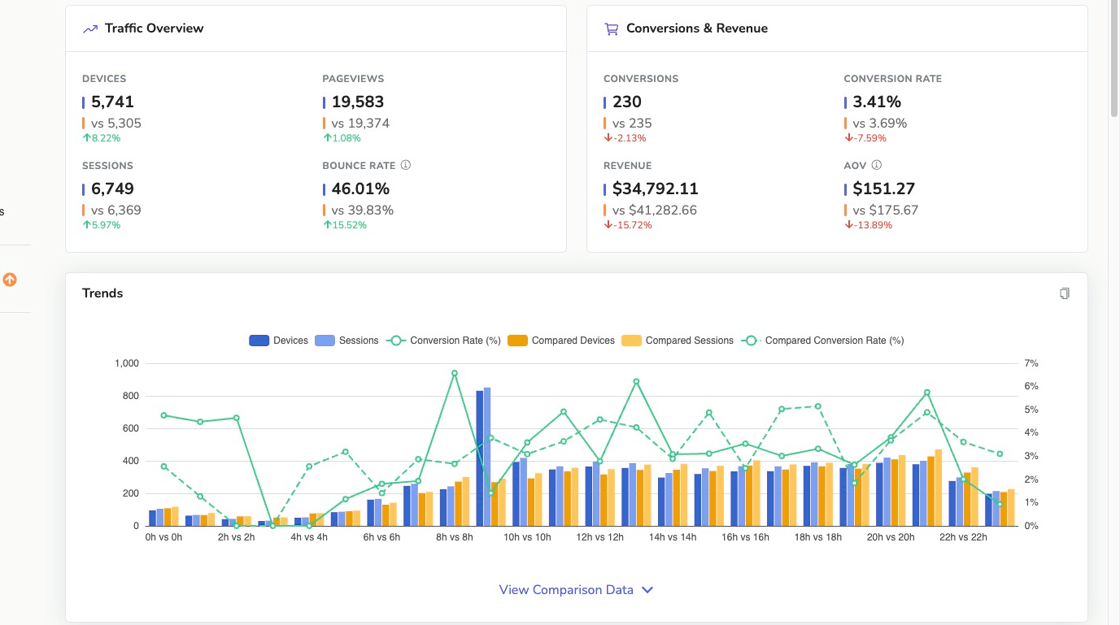
Monitor Your Website Performance
The dashboard enables you to measure the performance statistics for your entire website.
This includes:
- Website Traffic
- Conversion Rates
- Revenue
- Key device and session breakdowns
Monitor for any unusual changes in traffic or conversion rates, to know when to dive deeper.
Use these metrics as a benchmark to compare with specific audiences, or new features that you release.
Compare Date Ranges
Use date comparisons on your dashboard to analyze how performance has changed after a major website update, campaign launch, or new feature release.
How to compare date ranges:
- Open the Date Range picker on the Dashboard.
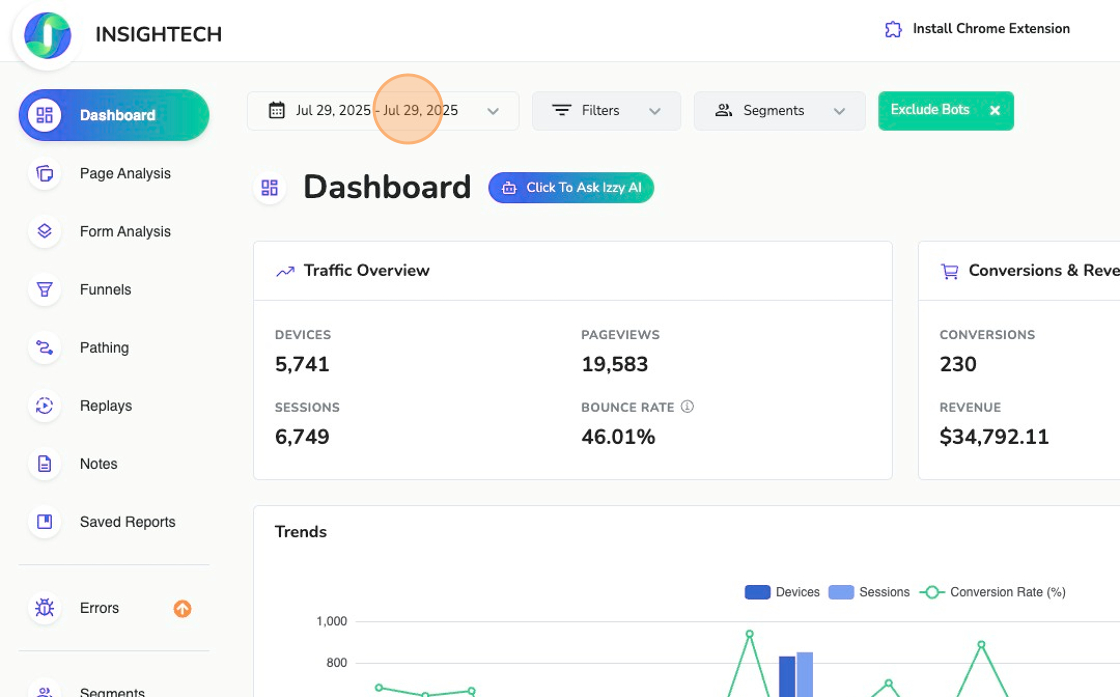
- Click Compare to enable comparison mode.
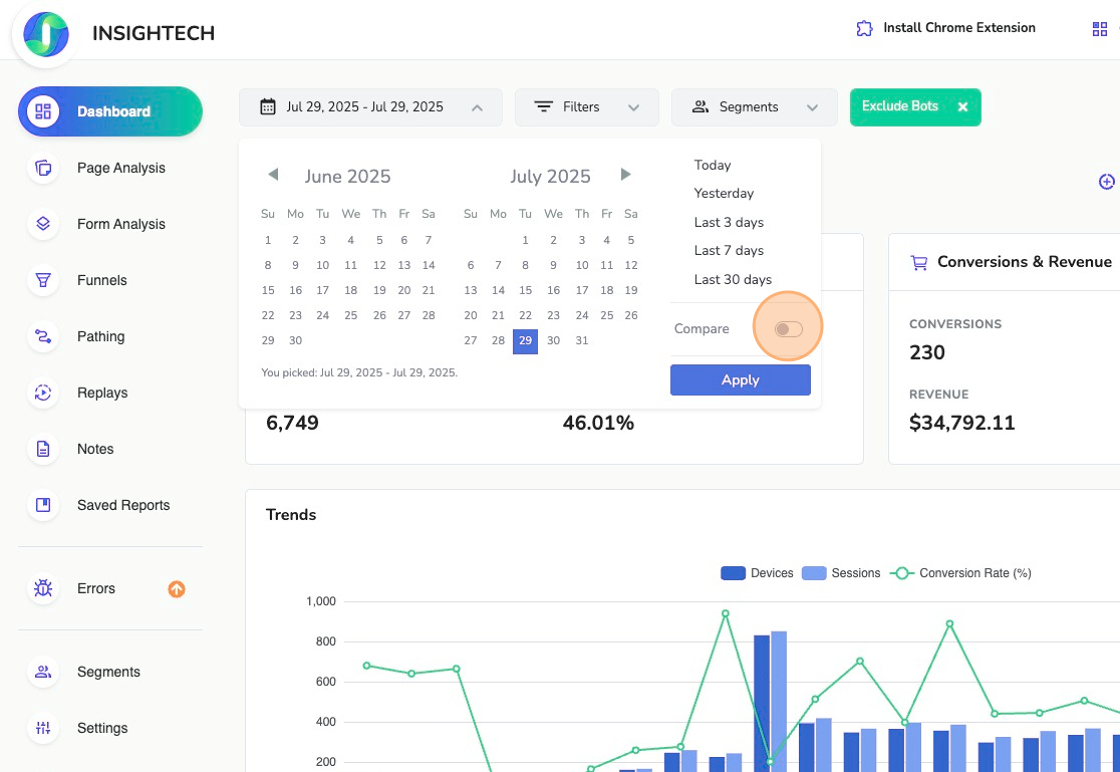
- Select the date ranges for your base date-range and your comparison date-range
- Click Apply to refresh the Dashboard.
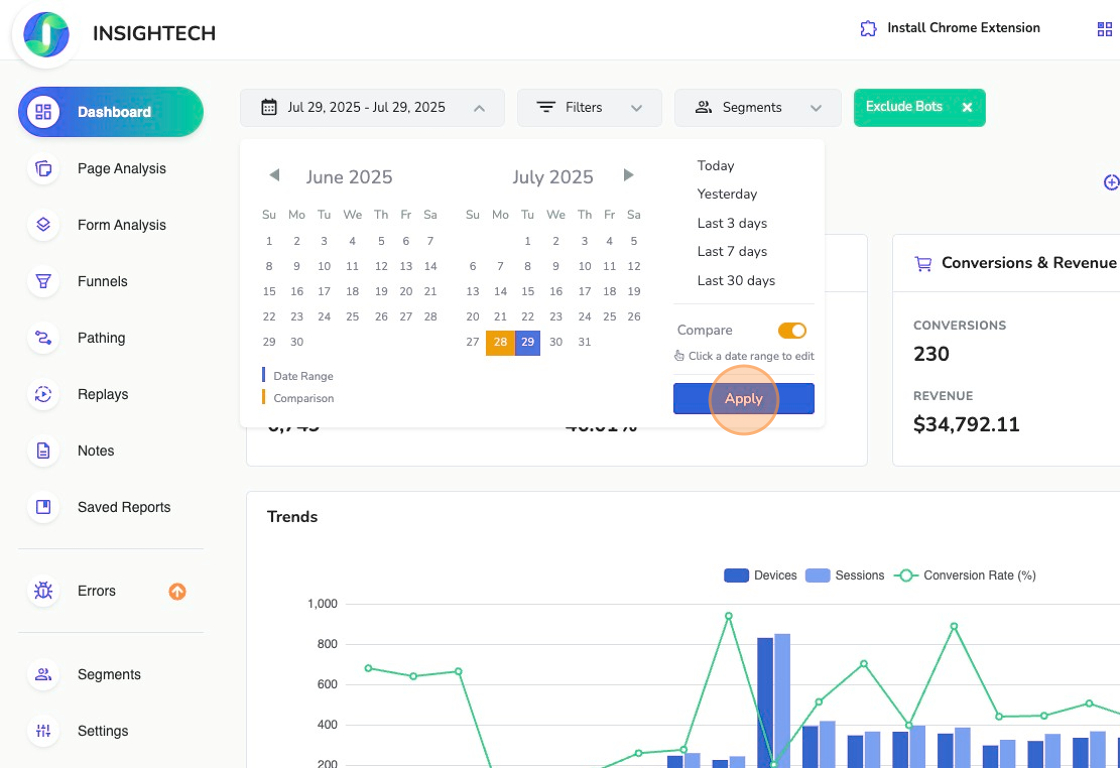
The Trends chart and metric tiles will display both periods side by side, allowing you to spot improvements or declines.
Filtering The Dashboard
You can click on any data point in a tile or chart to quickly filter the dashboard. This will temporarily add these details into your Filter Rules so that you can start exploring this audience/channel.
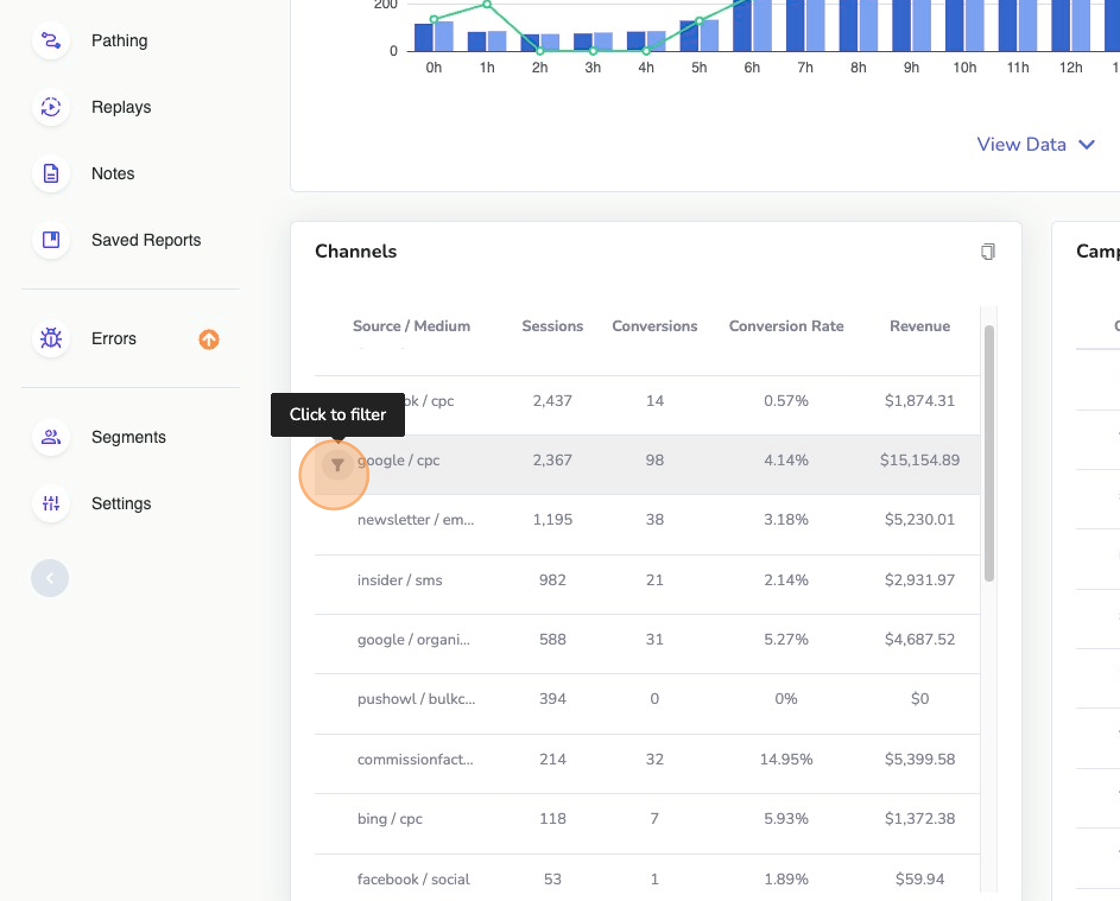
You can either save these rules as a segment for quick access, or also a Saved Report that can be used as a regular weekly/monthly report.
Click on a Filter Icon against any other attributes in the dashboard that you want to filter by, and these details will be added to your report.
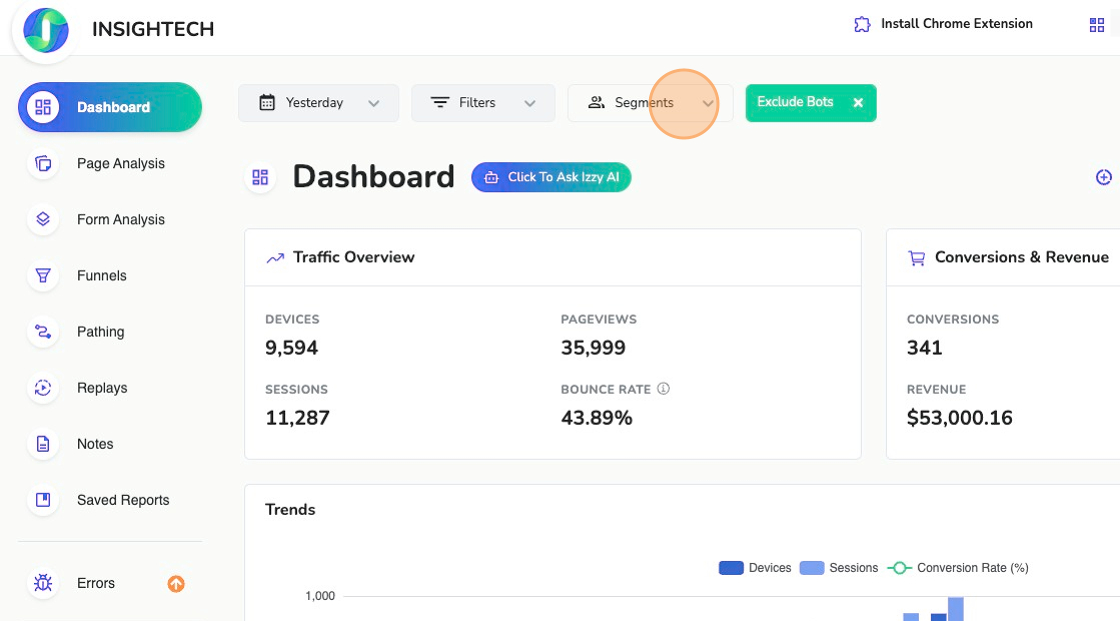
Compare Segments/Audiences
Once you have created Segments you can compare them in the Dashboard to see the differences in conversion impact. This is very helpful in comparing the performance of different features, channels, devices or audiences.
How to compare Segments:
- Open the Segments drop down on the Dashboard.
- Click Compare Segments to enable comparison mode.
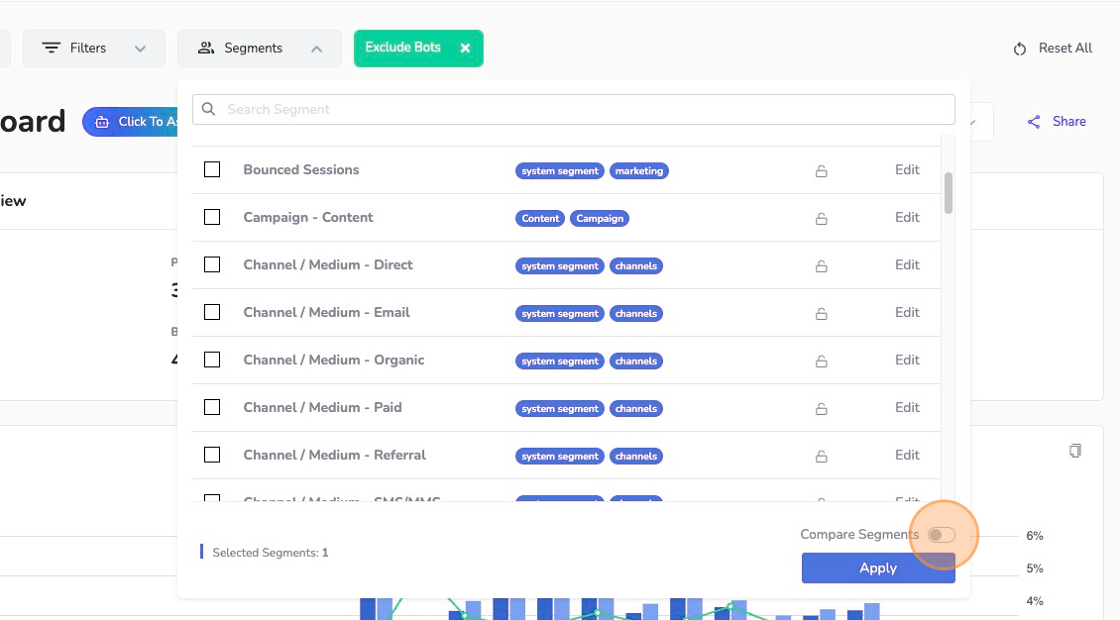
- Select the segments you want to compare
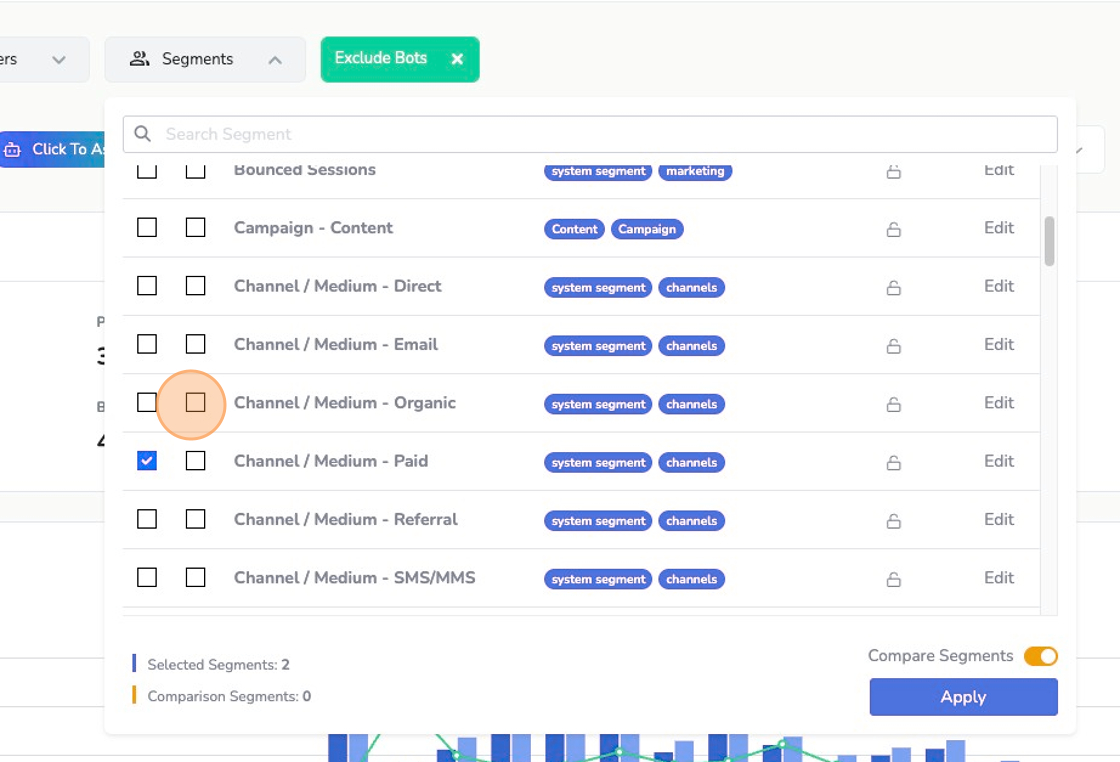
- Click Apply to refresh the Dashboard.
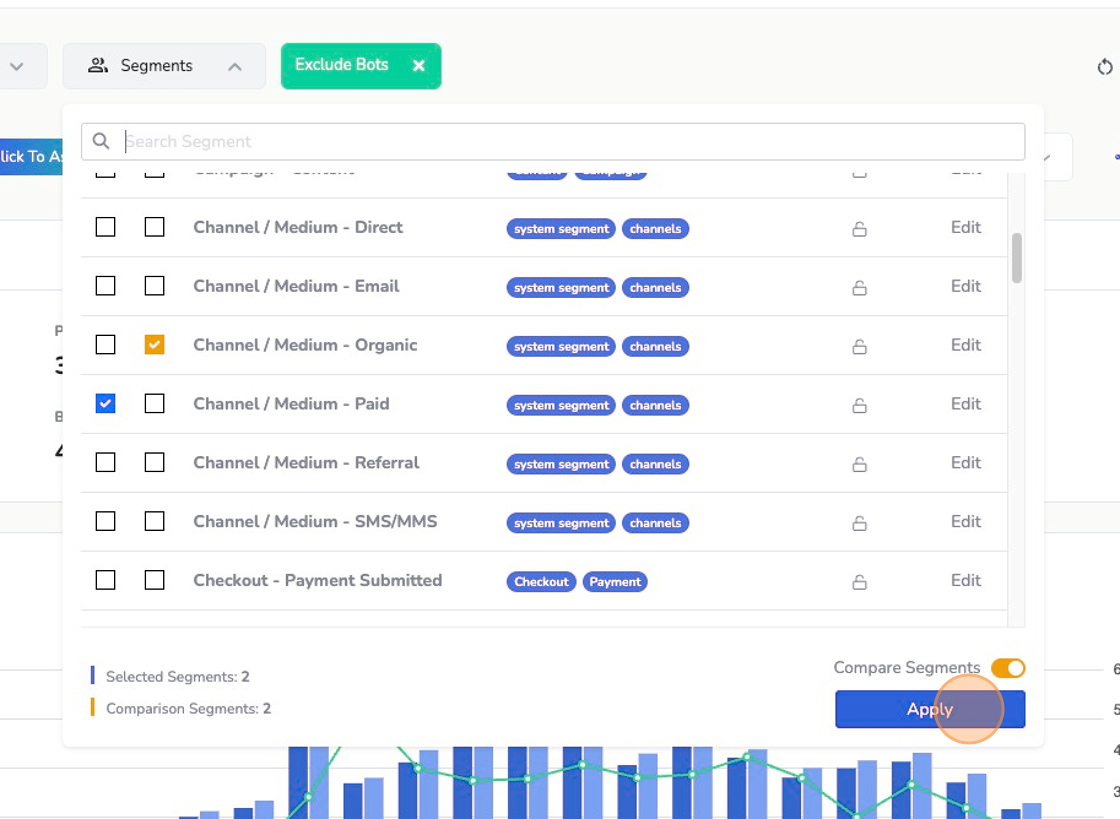
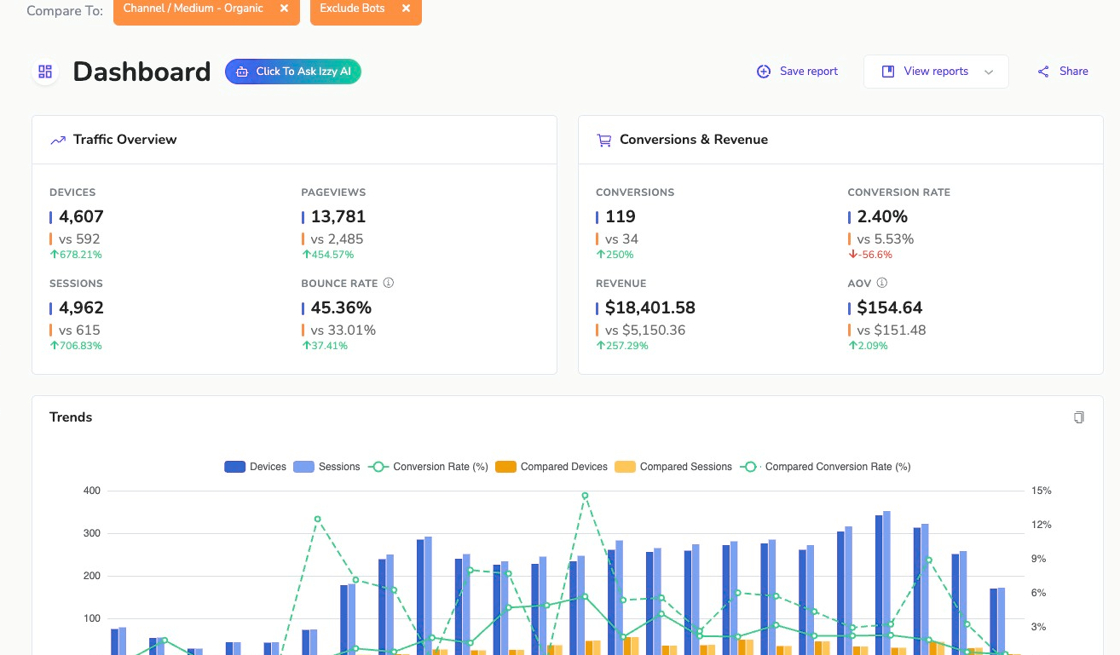
The Trends chart and metric tiles will display both segments side by side, allowing you to spot how they differ in performance.
For more detailed examples and step‑by‑step instructions, see our Filters & Segments article.
Saving Custom Dashboard Reports
To save a custom dashboard for quick access for the team:
- Apply filters or segments that you want to save in your report
- Click Save report and give your report a name.
You can now access your saved report under the View Reports menu on the report you just saved it against, or visit the Saved Reports page in the left-hand navigation.
For full instructions on naming, sharing and managing saved views, see our Saved Reports article.
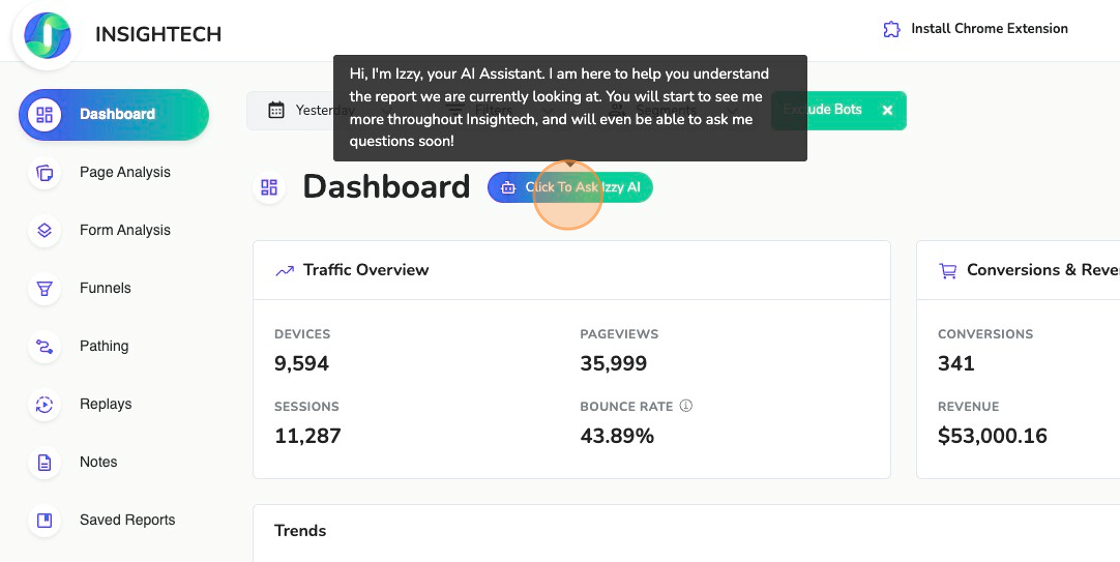
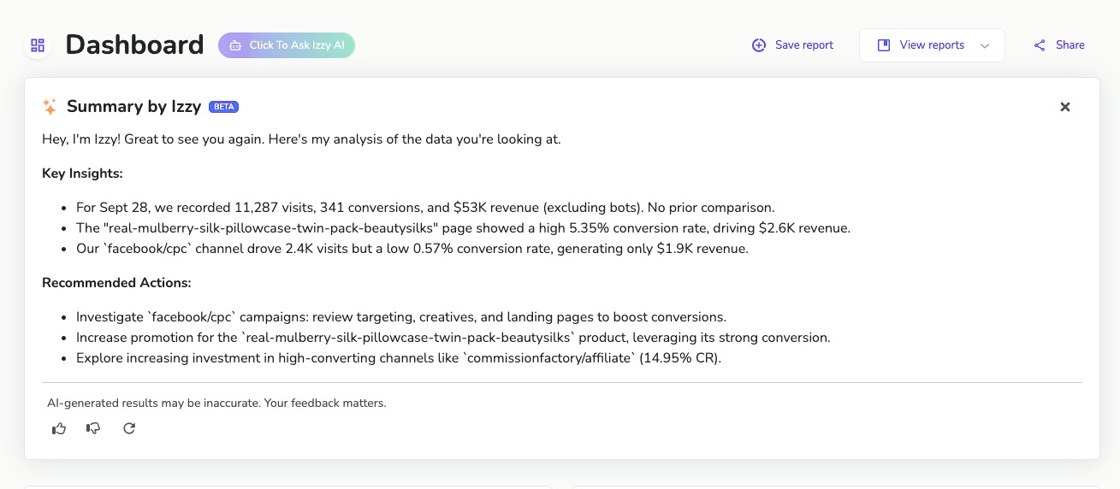
Ask Izzy (AI) for Additional Insights
Izzy is here to help you understand your Insightech reports better. If you see her in your report, you can click her to ask for her opinion on the report you are currently looking at.
How to get Help from Izzy with your Insights
- Apply the date range, comparison, or audience you want Izzy to help with
- Click "Click to ask Izzy AI". Izzy will now analyze the data that is currently showing in the dashboard.
- Review the Insights that Izzy has shared, along with her recommendations
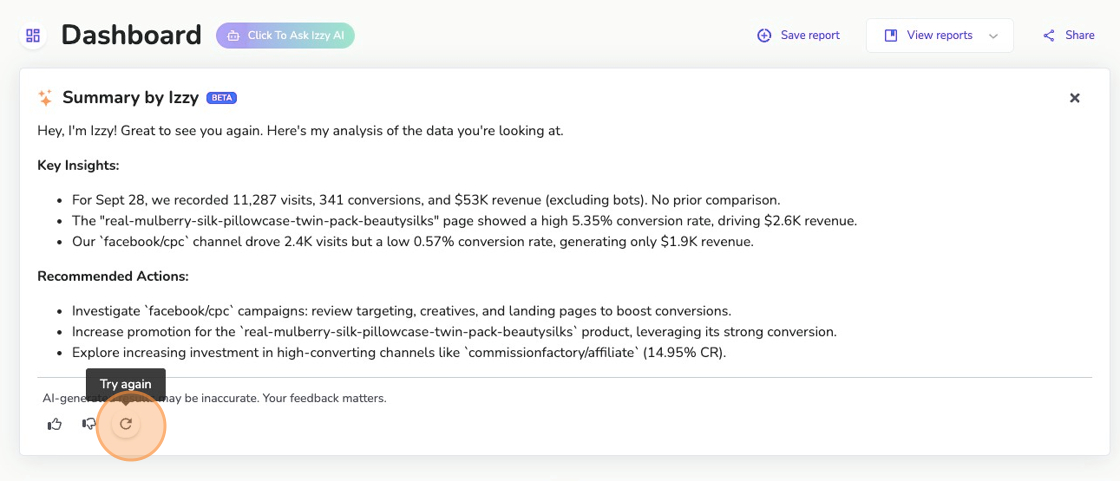
- (Optional) Click 'Try Again' if you want Izzy to dig a bit deeper into something else
Common Ways to Get Izzy's Help
- Look at the current report for insights
- Save Weekly Reports under Saved Reports and each week, click Izzy to generate your weekly reports.
- Compare 2 date ranges where you have seen a conversion drop, and ask Izzy to explain what happened
- Compare 2 audiences, and ask Izzy what's different about them