What are Insightech Visual Form Reports?
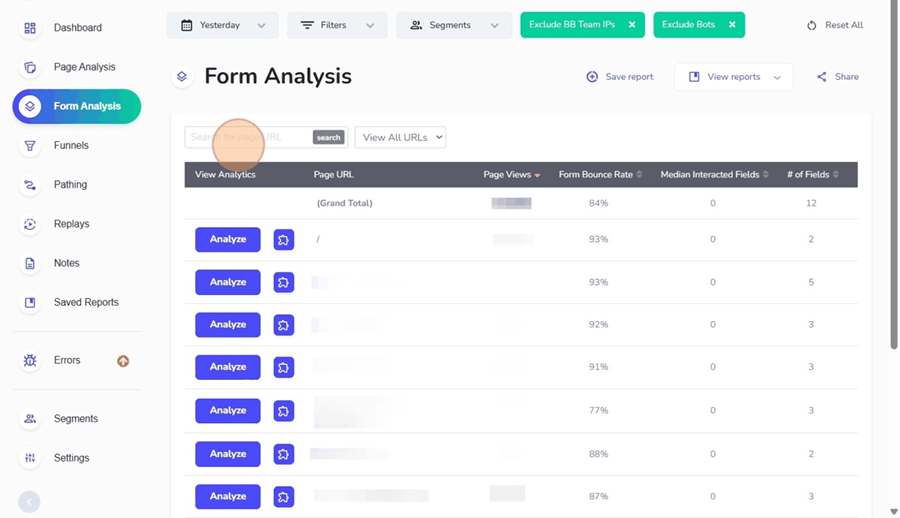
The Form analysis report automatically identifies any of your webpages that have input fields (i.e. there is a form field on the page), and shows engagement metrics based on how much people interact with those forms.
You can also click into examples of that page (click 'Analyze') to see drop off points on form fields and where users get stuck.
Understanding The Form Analysis Metrics
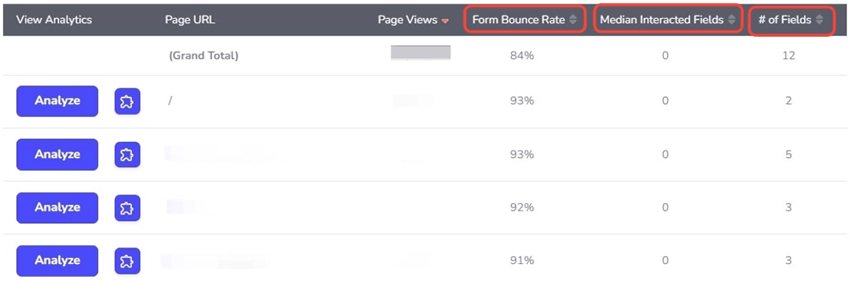
The table lists each detected form along with key engagement metrics:
- Form Bounce Rate - This is how many users load the form but don't start it.
- Median Interacted Fields - This is the median number of input fields that are interacted with.
- Number of fields - The total number of input fields detected on the page.
How to access Visual Form Reports
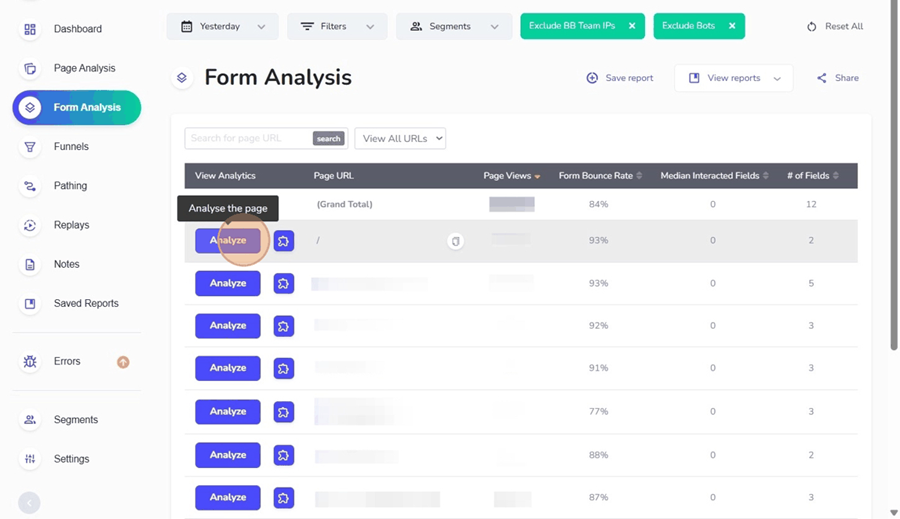
Step 1 - Click 'Analyze'
This opens an example of each form to overlay clickmaps visually on your forms. These will show the highest drop off points from each of your form fields.
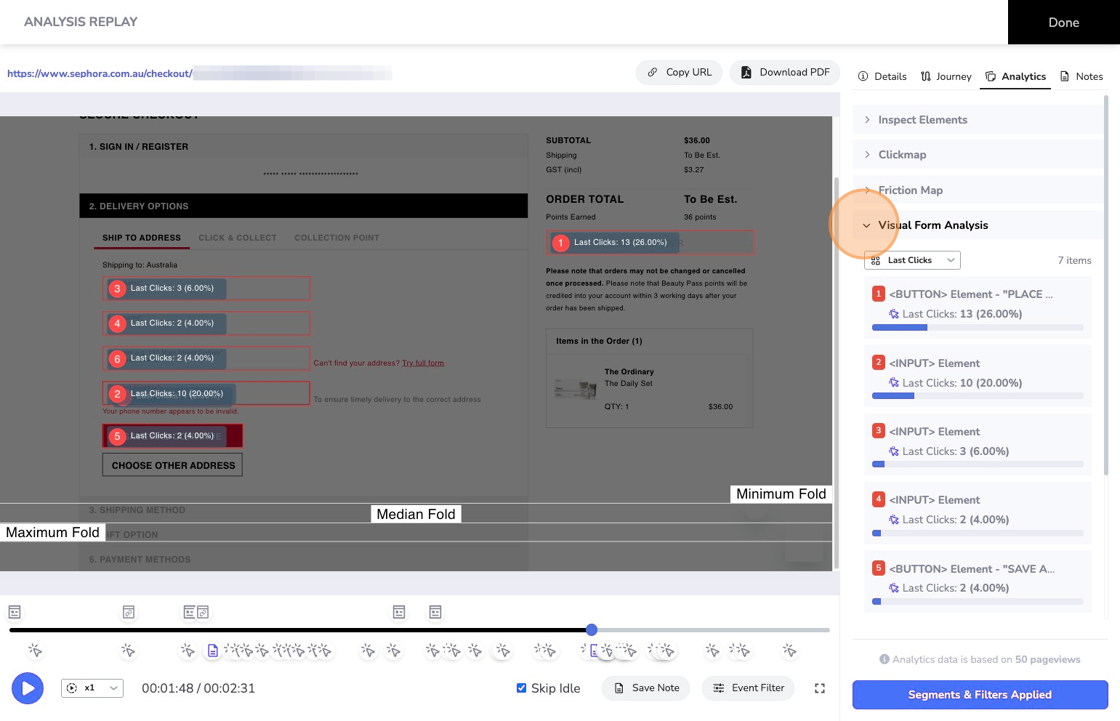
Step 2 - Open Visual Form Analysis
When looking at a page with a form (and form fields), you can open up the Analytics Tab --> Visual Form Analysis to overlay clickmaps on your form. Form Analysis reports will automatically detect each form field and button in your form to show a list of where users are likely getting stuck, and what potentially needs to be fixed.
Understanding Form Analysis Clickmaps
Once you have overlaid a form clickmap, you will see data overlaid on the actual fields, and also a list of that information on the right-hand side panel.
- The red number is the ranking of each field/element in the right hand list. A red #1 means your element is either the most clicked, or the most dropped off field (based on which report you have chosen).
- Clicks is the number of unique clicks on the element, along with a % of total pageviews that fell into this group.
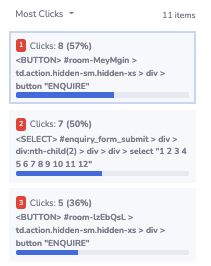
Types of Form Analysis Clickmaps
- Most Clicked - Shows which fields are being interacted with the most throughout your form
- Last Clicked - Shows the last interaction point on your form. A high number of drop offs here means you may have a problem with this form field/step.
Searching and Filtering Forms
To filter your list of pages to show form pages, simply type in a unique part of the page URL that you want to search for within the Search for page path bar and click search.
This is an easy way to find specific pages in the pages list.
Using this filter you can group pages with forms together to compare their performance against each other. You will see a summary of performance above your list, which you can benchmark each page against.
You can then click 'Analyze' to look at visual form reports of low-performing pages to see what can be improved.
Using Segments to Dive Deeper
Segments can be used to understand different audiences and to determine whether a specific subsection for users progress further in input forms than others.
For instance, this can be used to find potential issues that needs to be addressed by applying filters to those users who do not click on the input form relative to those that do
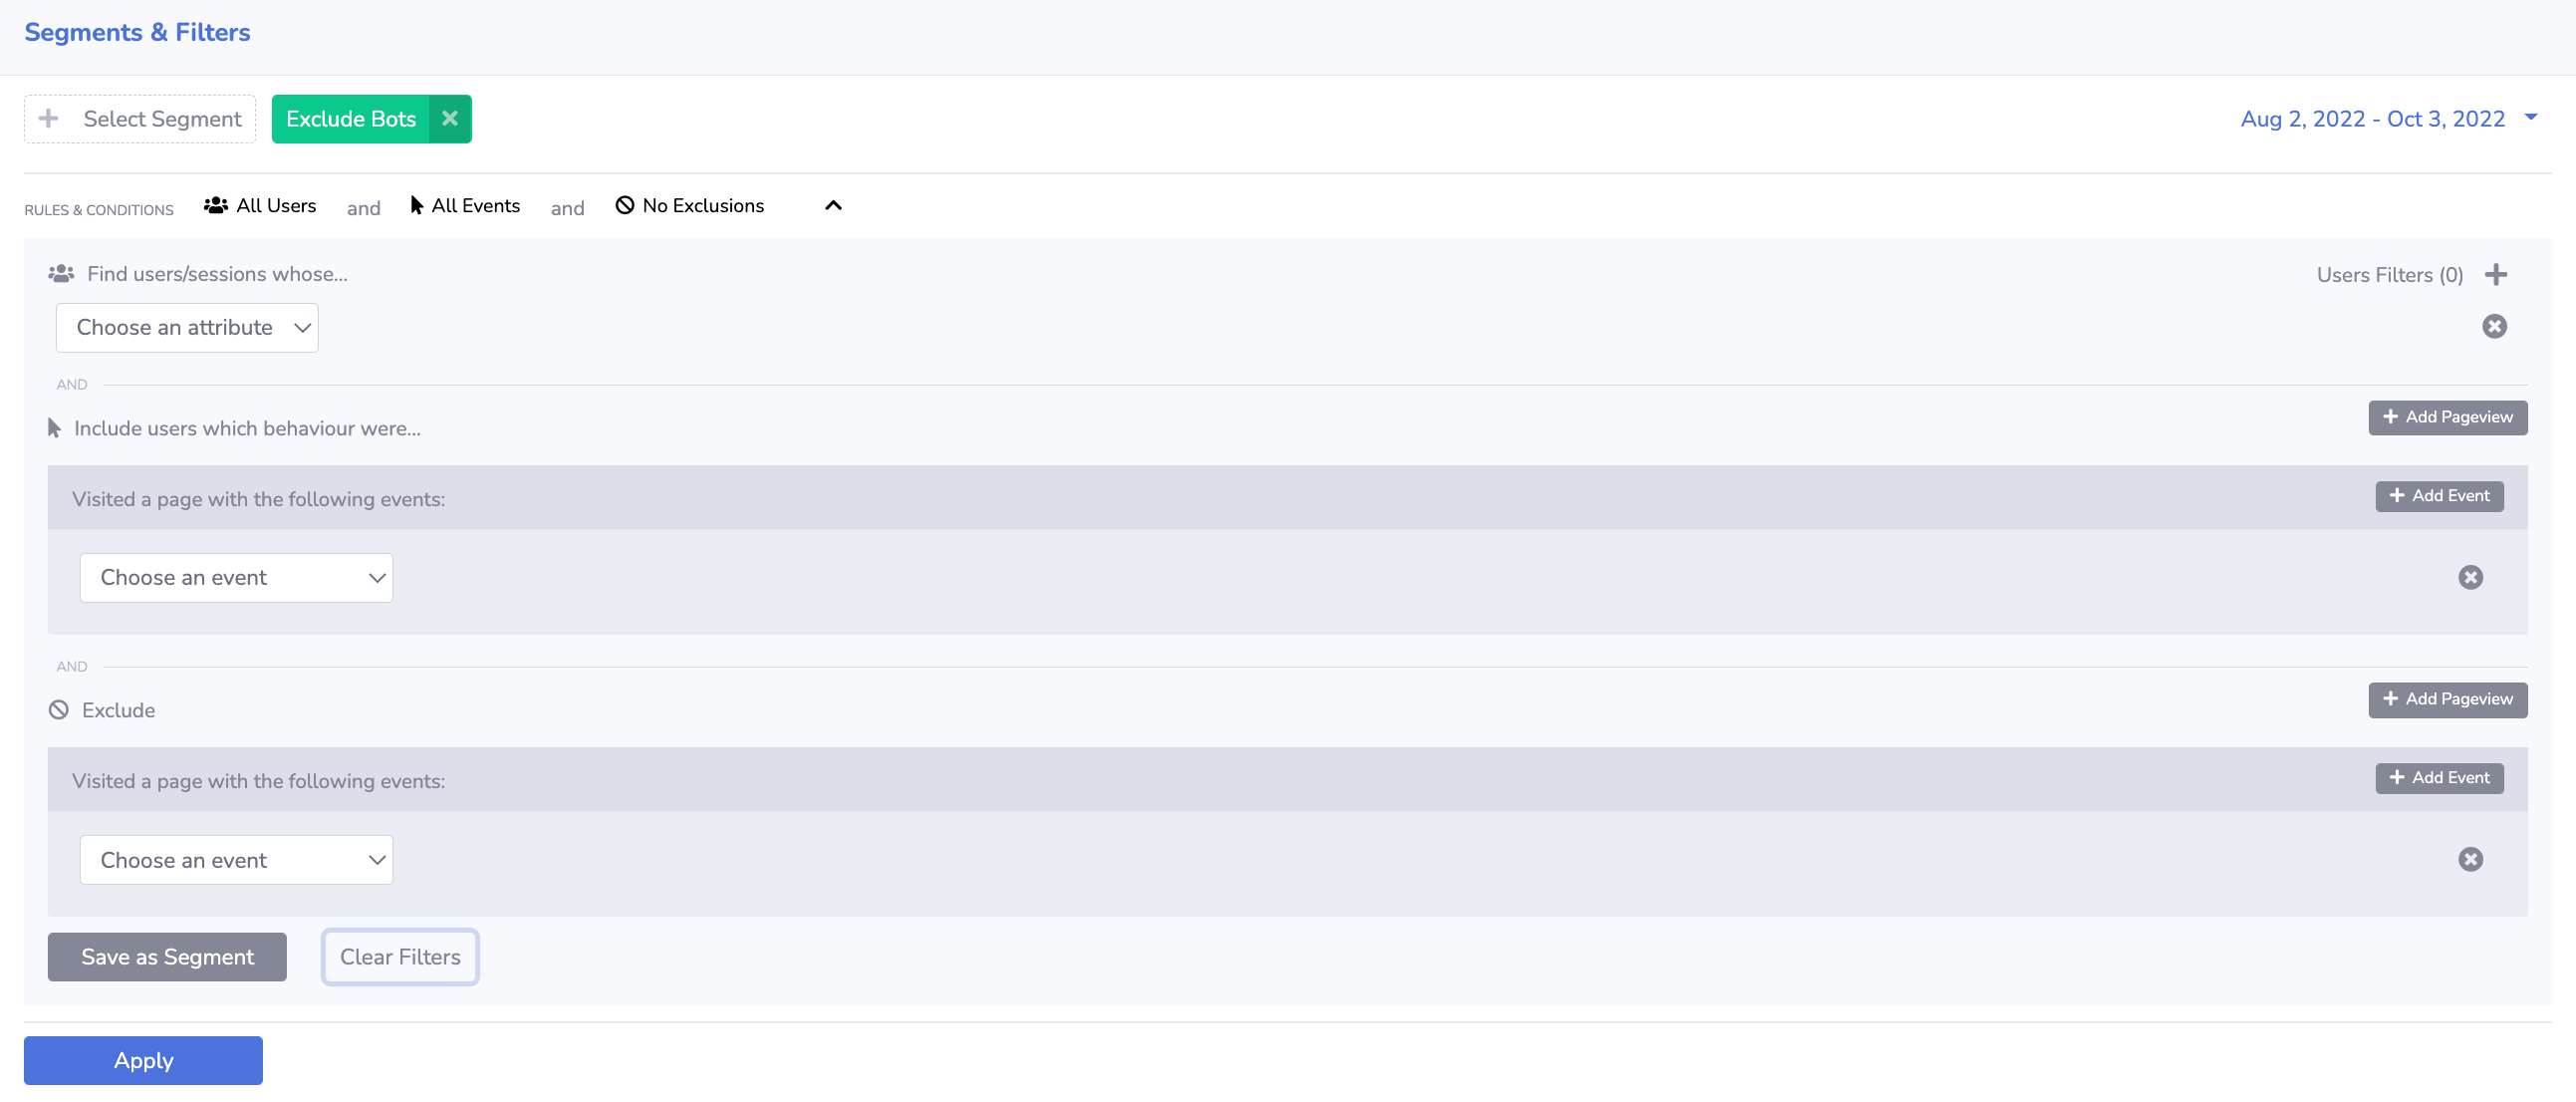
Click here to for our segments and filters article to learn more.
Form Analysis on Dynamic Content
Form analysis can work with all dynamic content within a particular webpage. Regardless of the regularly changing content, Insightech's form analysis can continue to operate.
If you would like to see heatmaps / clickmaps on dynamic content on your website, you can open your website and use the Insightech Chrome Extension.