What are Scrolling Heat Maps?
Interactive Scrolling Heatmaps will help you understand how far someone has scrolled and what content has been viewed.
See how many users reach each section of your page, and what content they have viewed.
How to Access Scrolling Heat Maps?
Scrolling heatmaps are overlaid on session replays and your live website.
You can access these through
- Page analysis reports - Click into any page example, to overlay click maps and scrolling heatmaps. Click for more info
- Session Replays - Pause any replay on a webpage or piece of content, to overlay clickmaps and scrolling heatmaps. Click for more info
- Insightech Chrome Extension - Download the chrome extension to navigate your live website and overlay clickmaps and scrolling heatmaps on top. Click for more info
How to Read Insightech Scrolling Heat Maps?
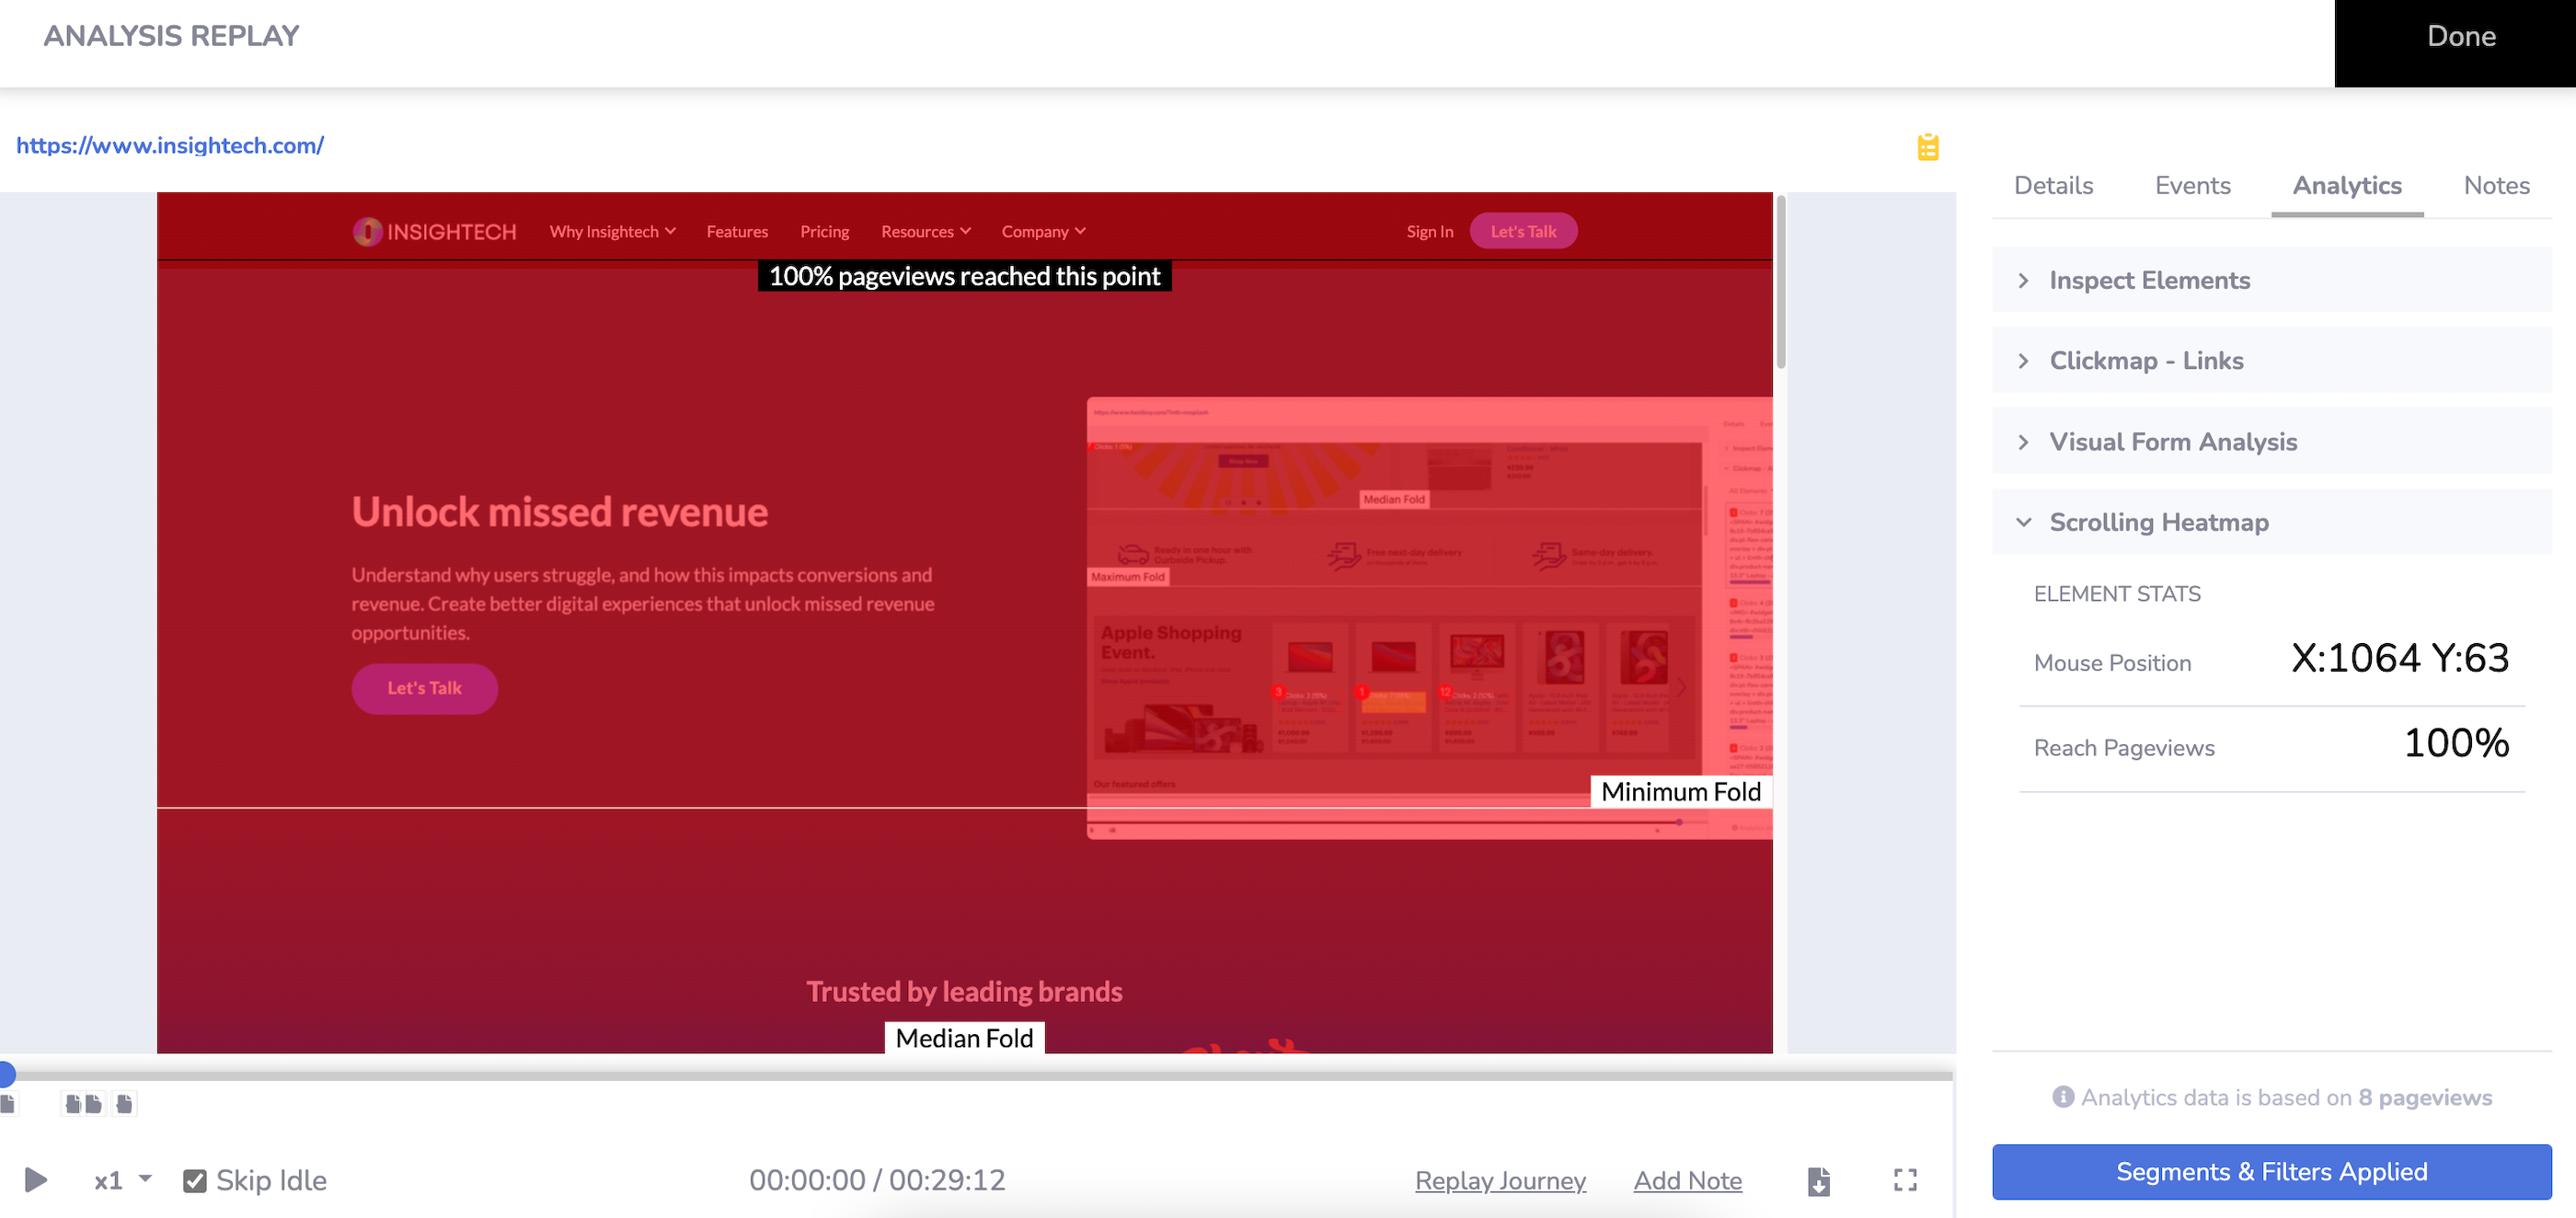
Main Session Replay Interface
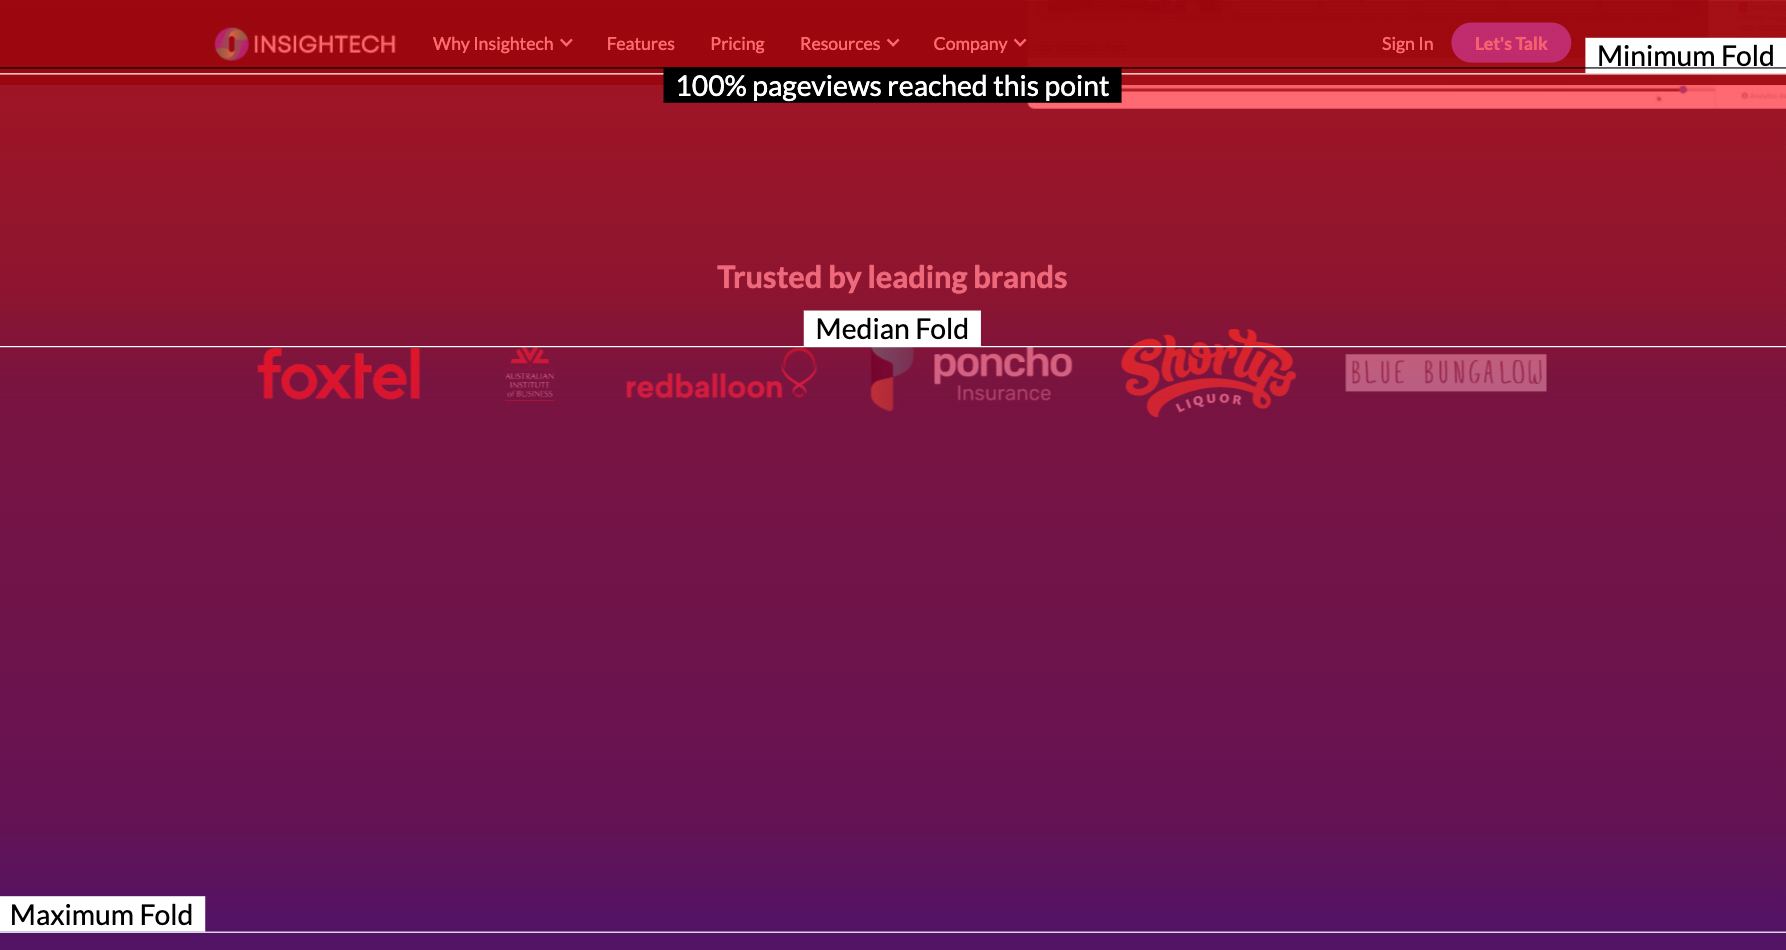
When viewing the scrolling heatmap, you will see a gradient of colour based on scroll rates down the page. You will also see some additional information such as the percentage of pageviews reaching each section of your webpage.
You will also see some key indicators:
- Minimum/Median/Maximum Fold Markers
- Interactive Scroll Tool-Tip
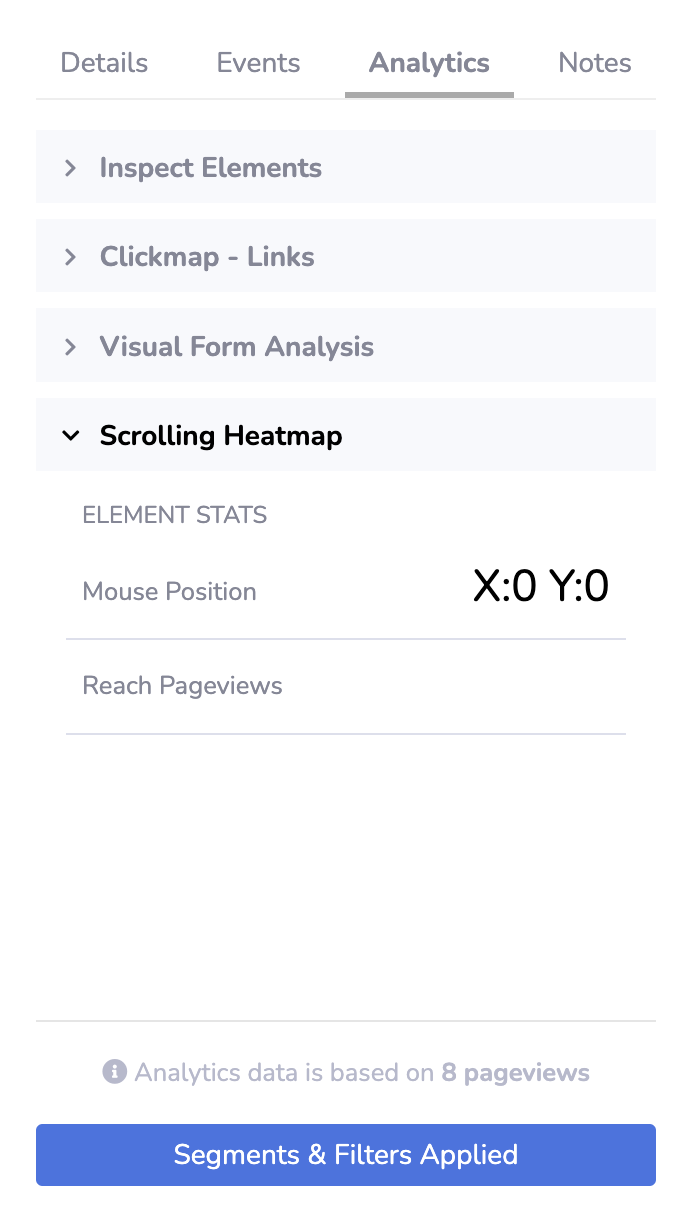
Sidebar
In the sidebar on the right-hand side of your scrolling heatmap are details on the mouse position, and the volume and percentage of pageviews that reach the point you have hovered over with your mouse.
Create a Segment From the Scrolling Heat Map View
Click on any interactive point on the scrolling heatmap report to create a segment.
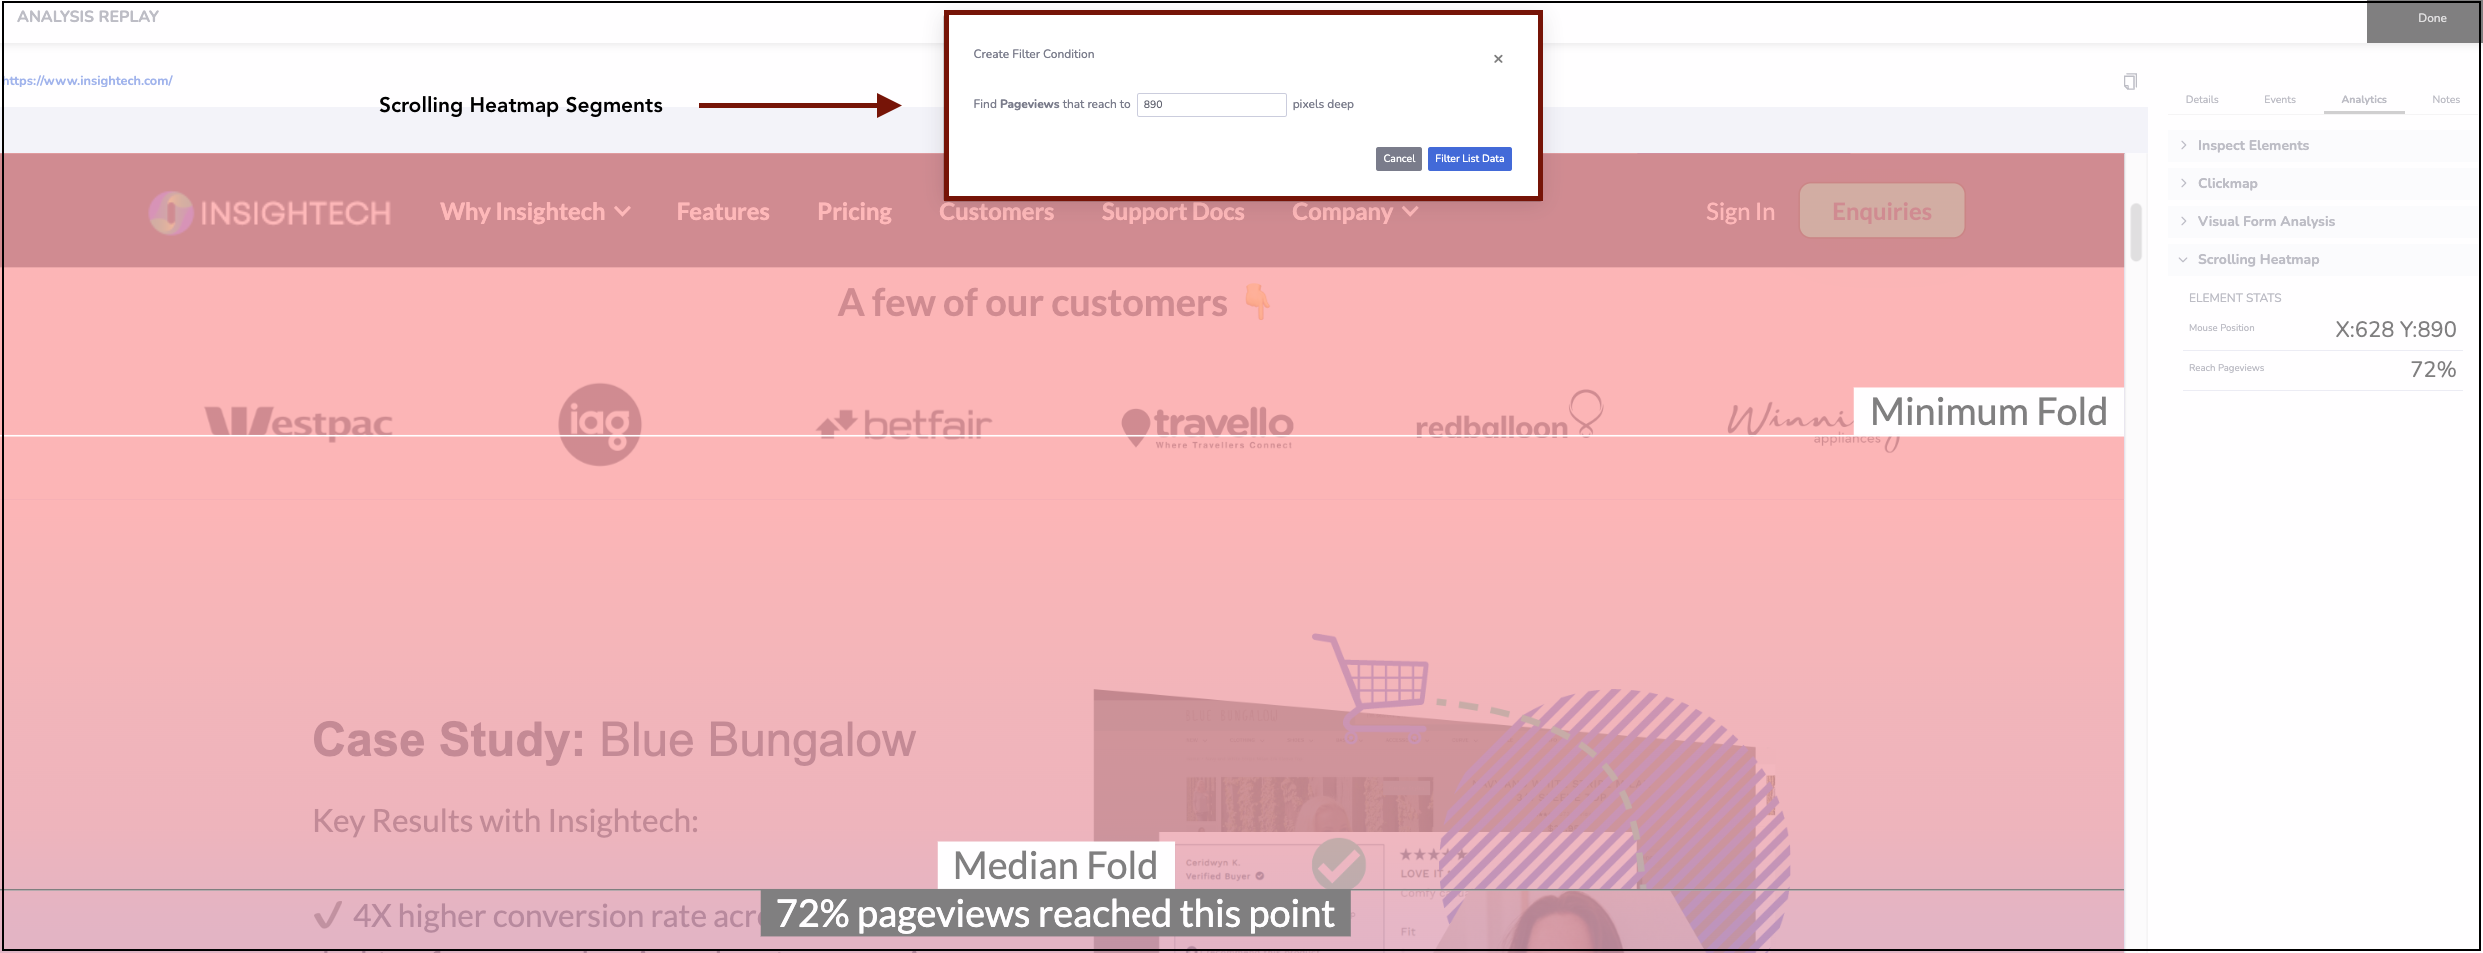
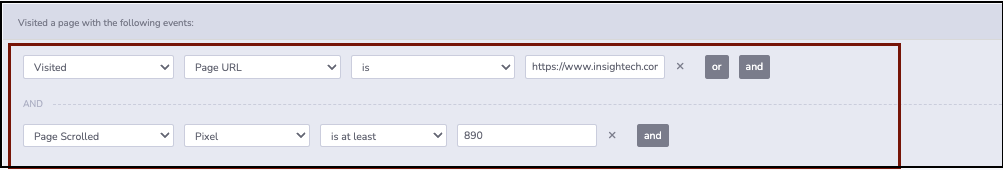
This segment will filter all users on this page that have scrolled where you have clicked on the scrolling heatmap report.
- This is done based on the pixel depth that your users reach when scrolling down on your webpage.
- Edit this segment from Insightech's segment builder to add addtional rules or modify how these users are filtered.
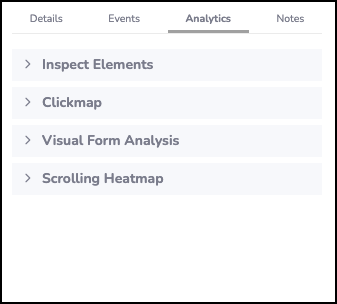
Choosing & Switching between Reports
Select the Analytics Tab in the right sidebar, and choose any other report to overlay on your page, including: