Analyse Website Content Engagement
With Insightech's content analysis, you can draw key insights about the components from your website to improve customer experience for future revenue opportunities.
Three ways for Content/UX Analysis with Insightech
- Analyse Click Map Revenue Report
- Measuring the impact of Content Seen
- Page Analysis for Content Engagement
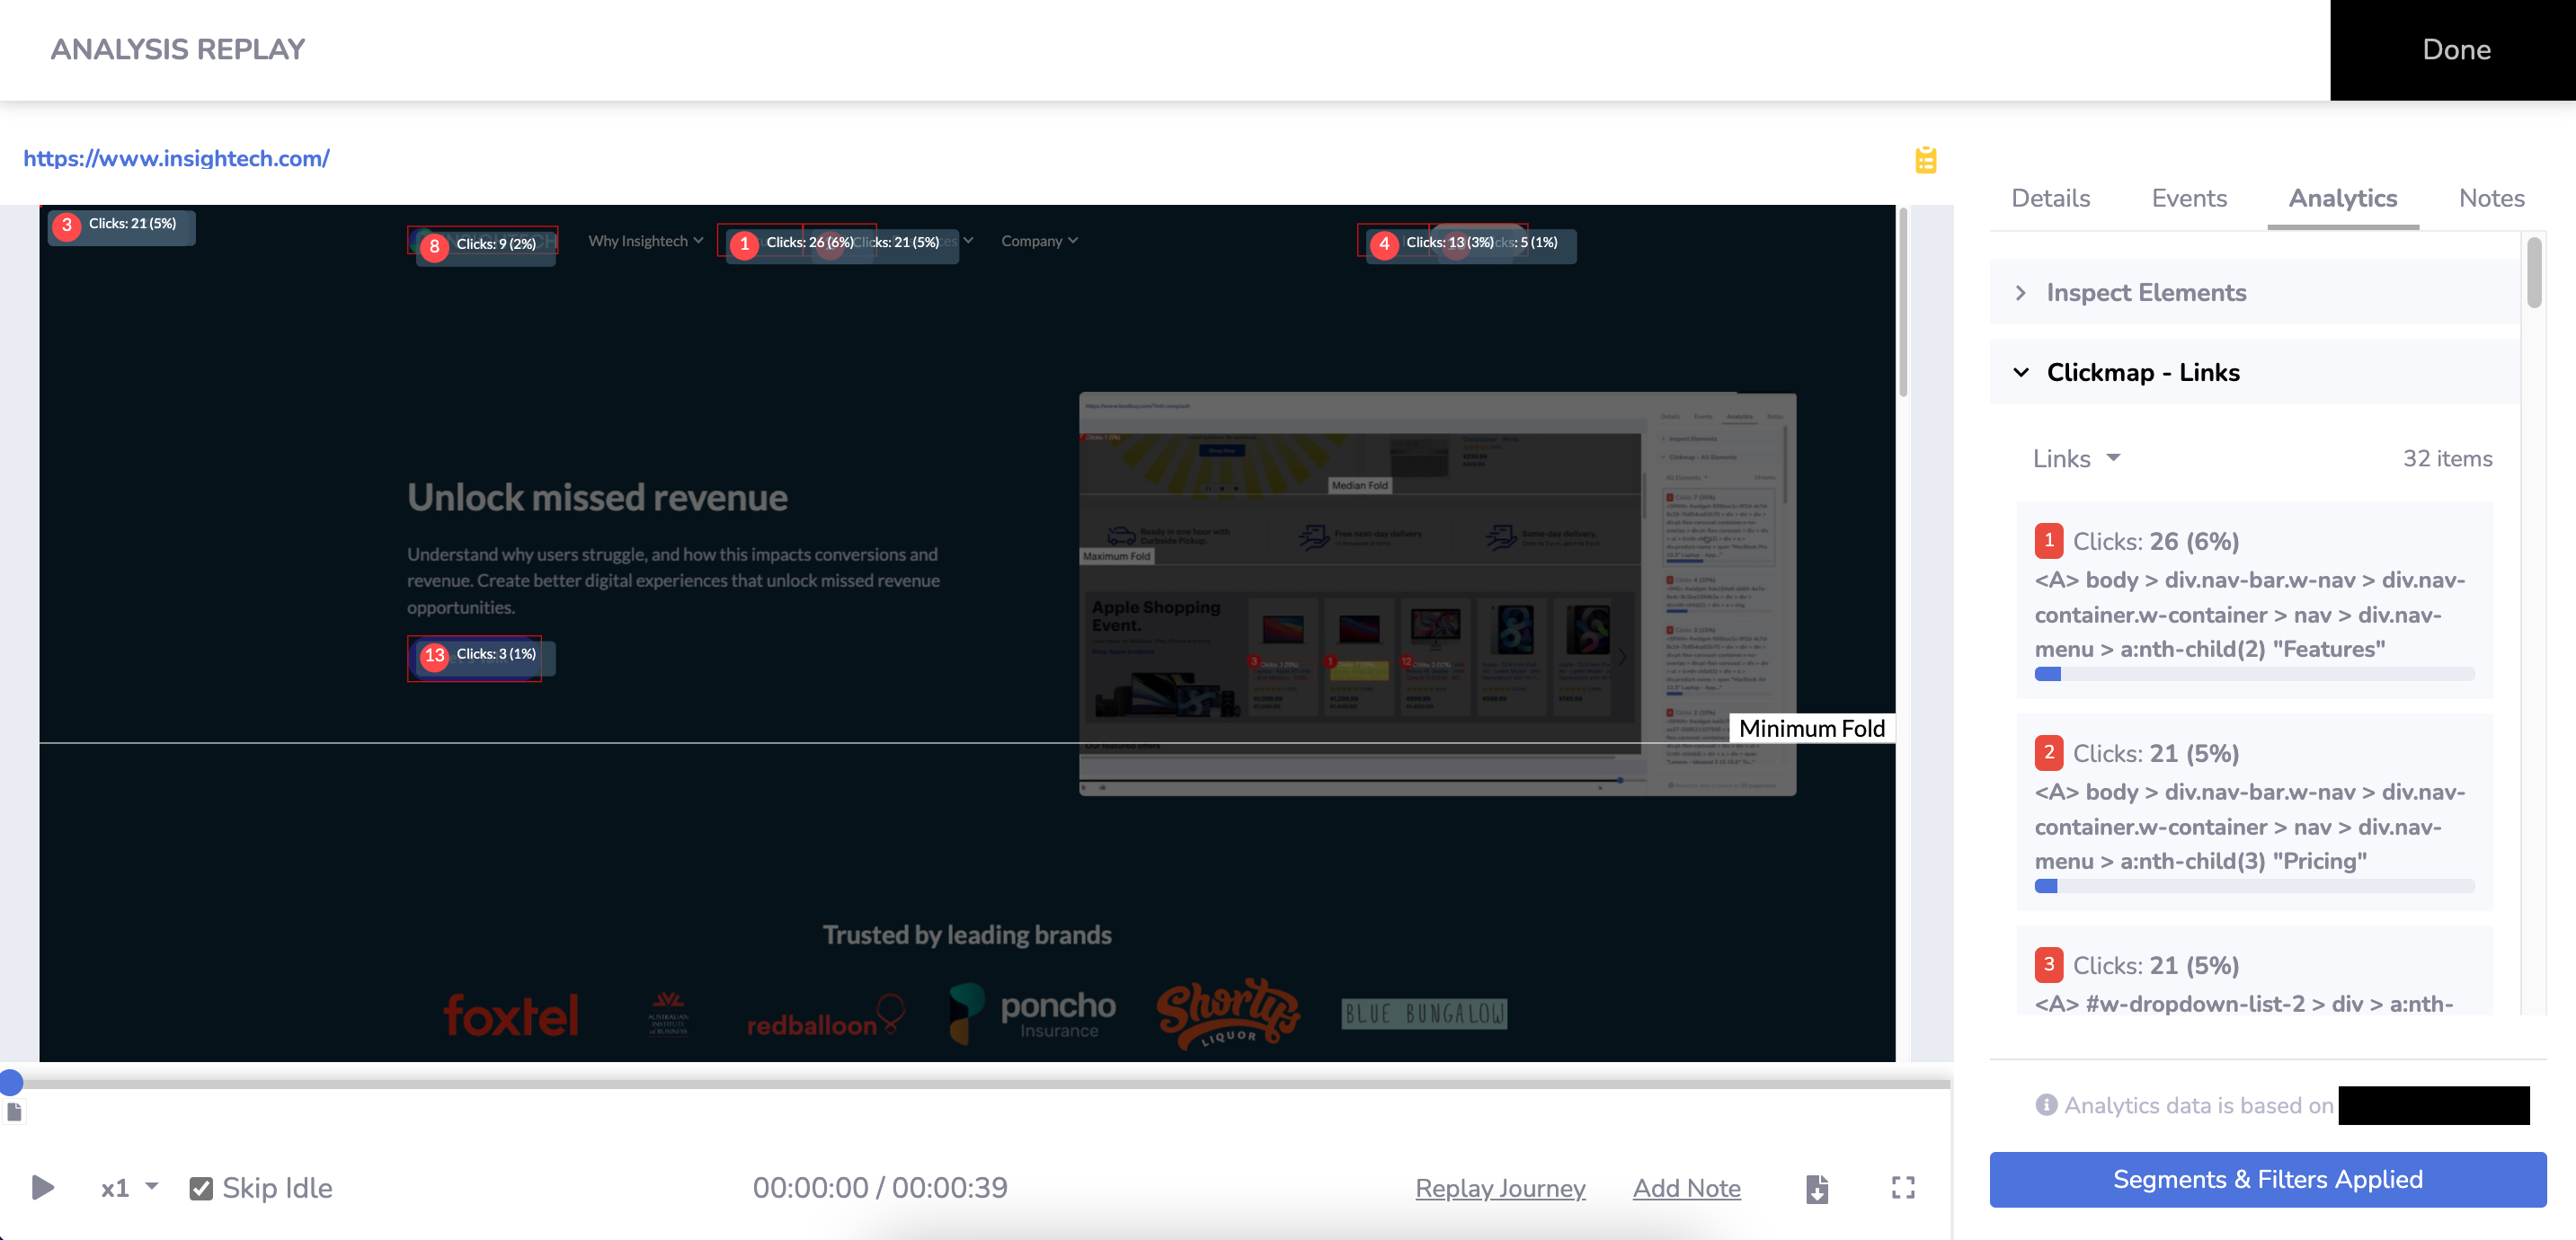
1. Analysing which content clicks drive revenue
Once you have set up your conversion metric in your Admin settings, you are able to see how much revenue each content click was involved with. You can then quickly compare which elements were involved in the highest amount of revenue.
Keep in mind, multiple elements can be involved in the same conversion, so you should not be adding together revenue figures between elements. This report is simply to compare revenue drivers.
Click here here for more info on the set-up and capabilities of conversion metric tracking.
2. Measuring the Impact of Content that users actually see
Insightech's Scrolling Heat Map allows you to see what users have actually viewed on a page.
To take this one step further, clicking the scrolling heatmap allows you to create a segment for users who have seen that section of the page. Applying these segments to your funnels will provide you conversion rates of each section of content seen throughout your pages.
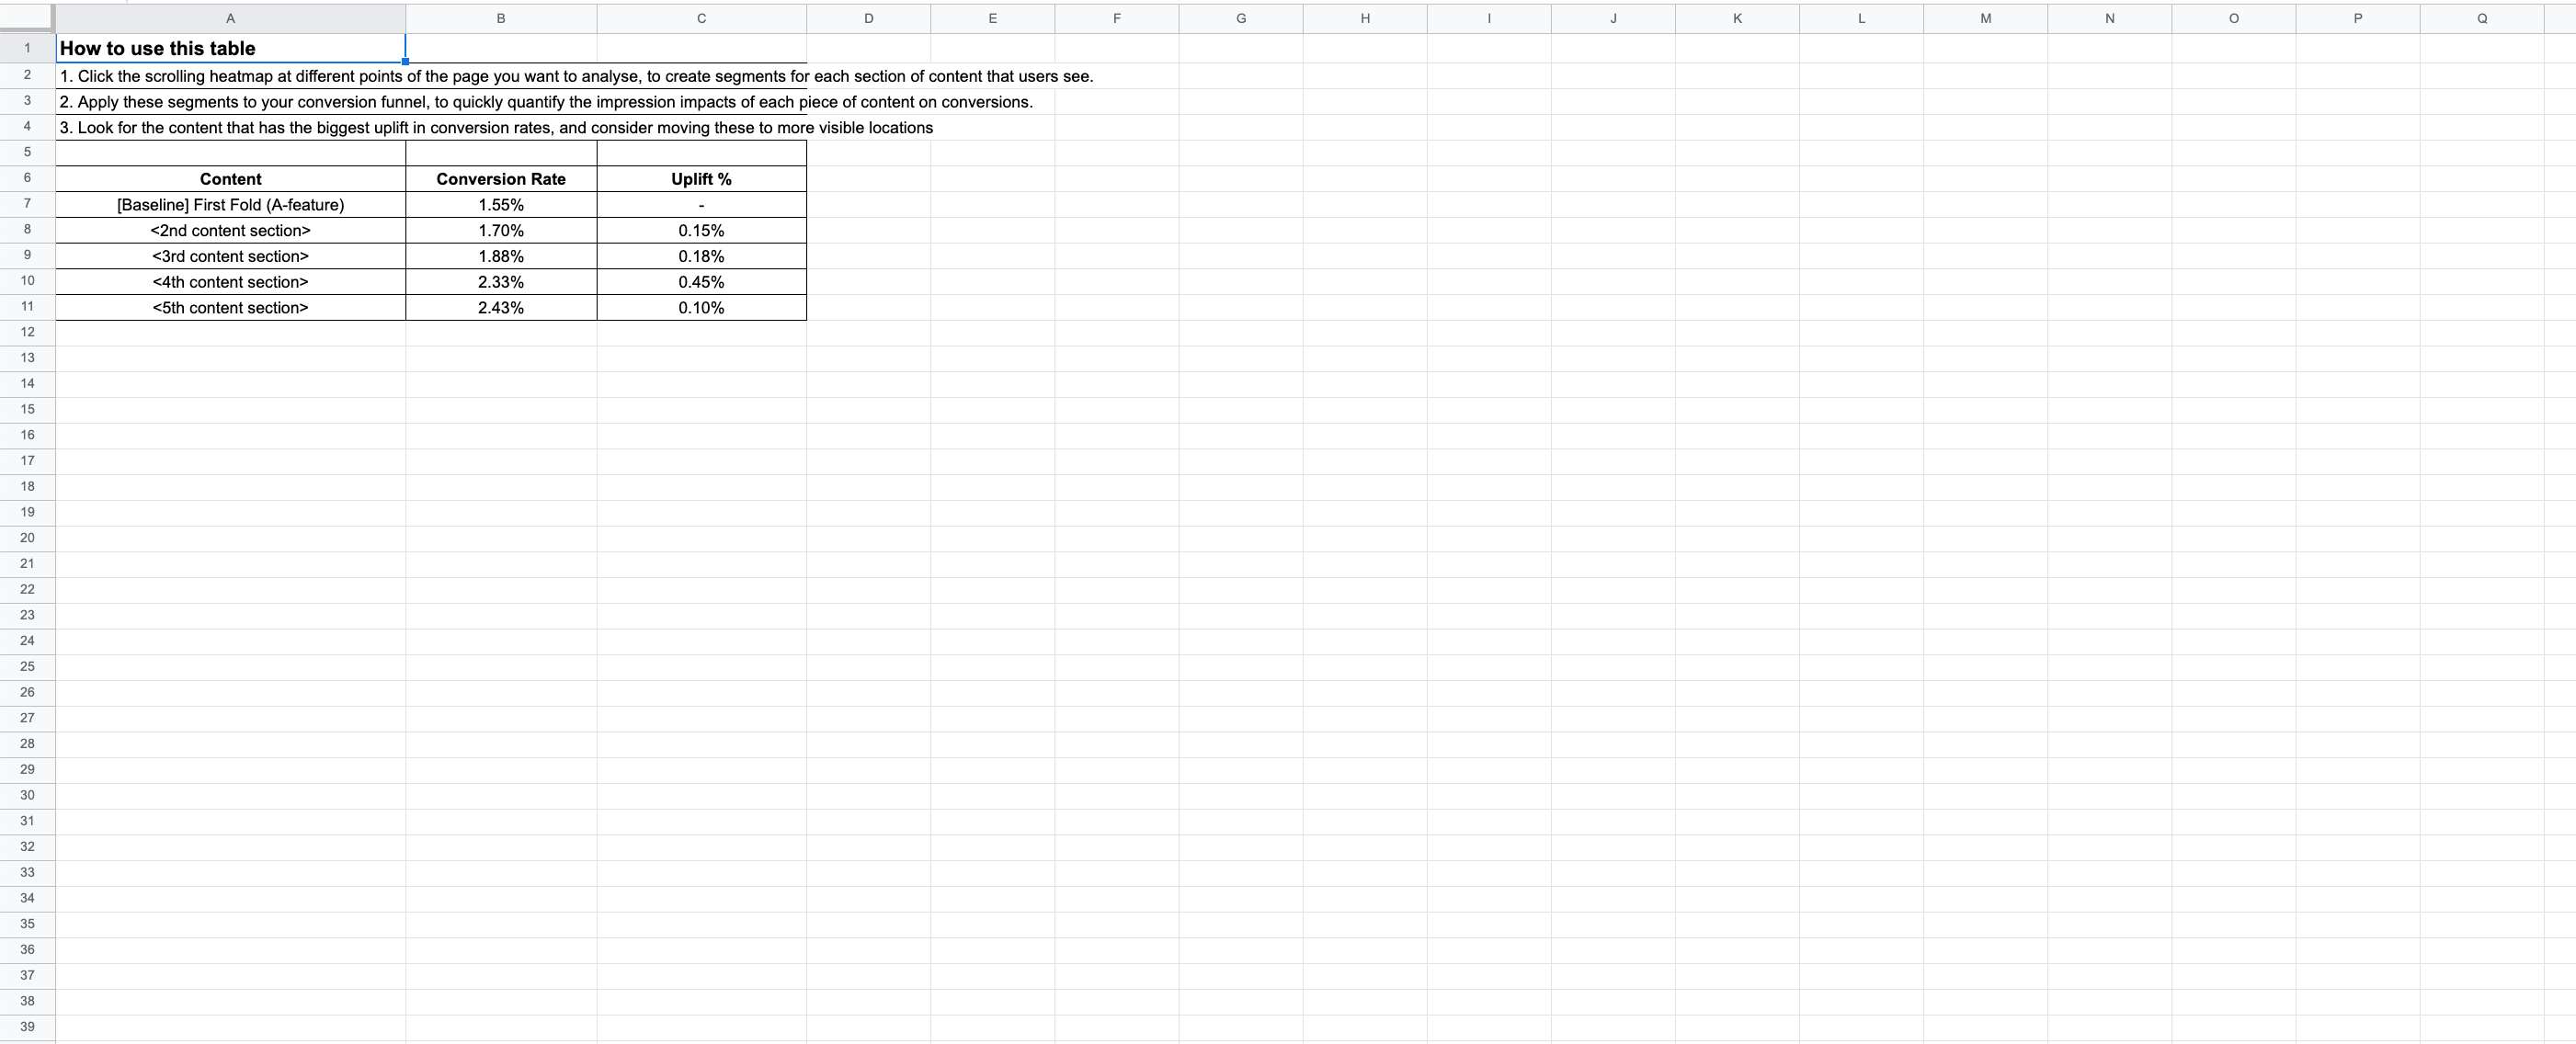
Click here for a template that you can use to analyse content throughout a page.
Below is a Step-By-Step Guide
- Navigate to Page Analysis within Insightech
- Select a which page URL you want to analyse, once you have applied any filters and segments that you want applied
- Select Analysis --> Scrolling Heat Map in the Session Replay
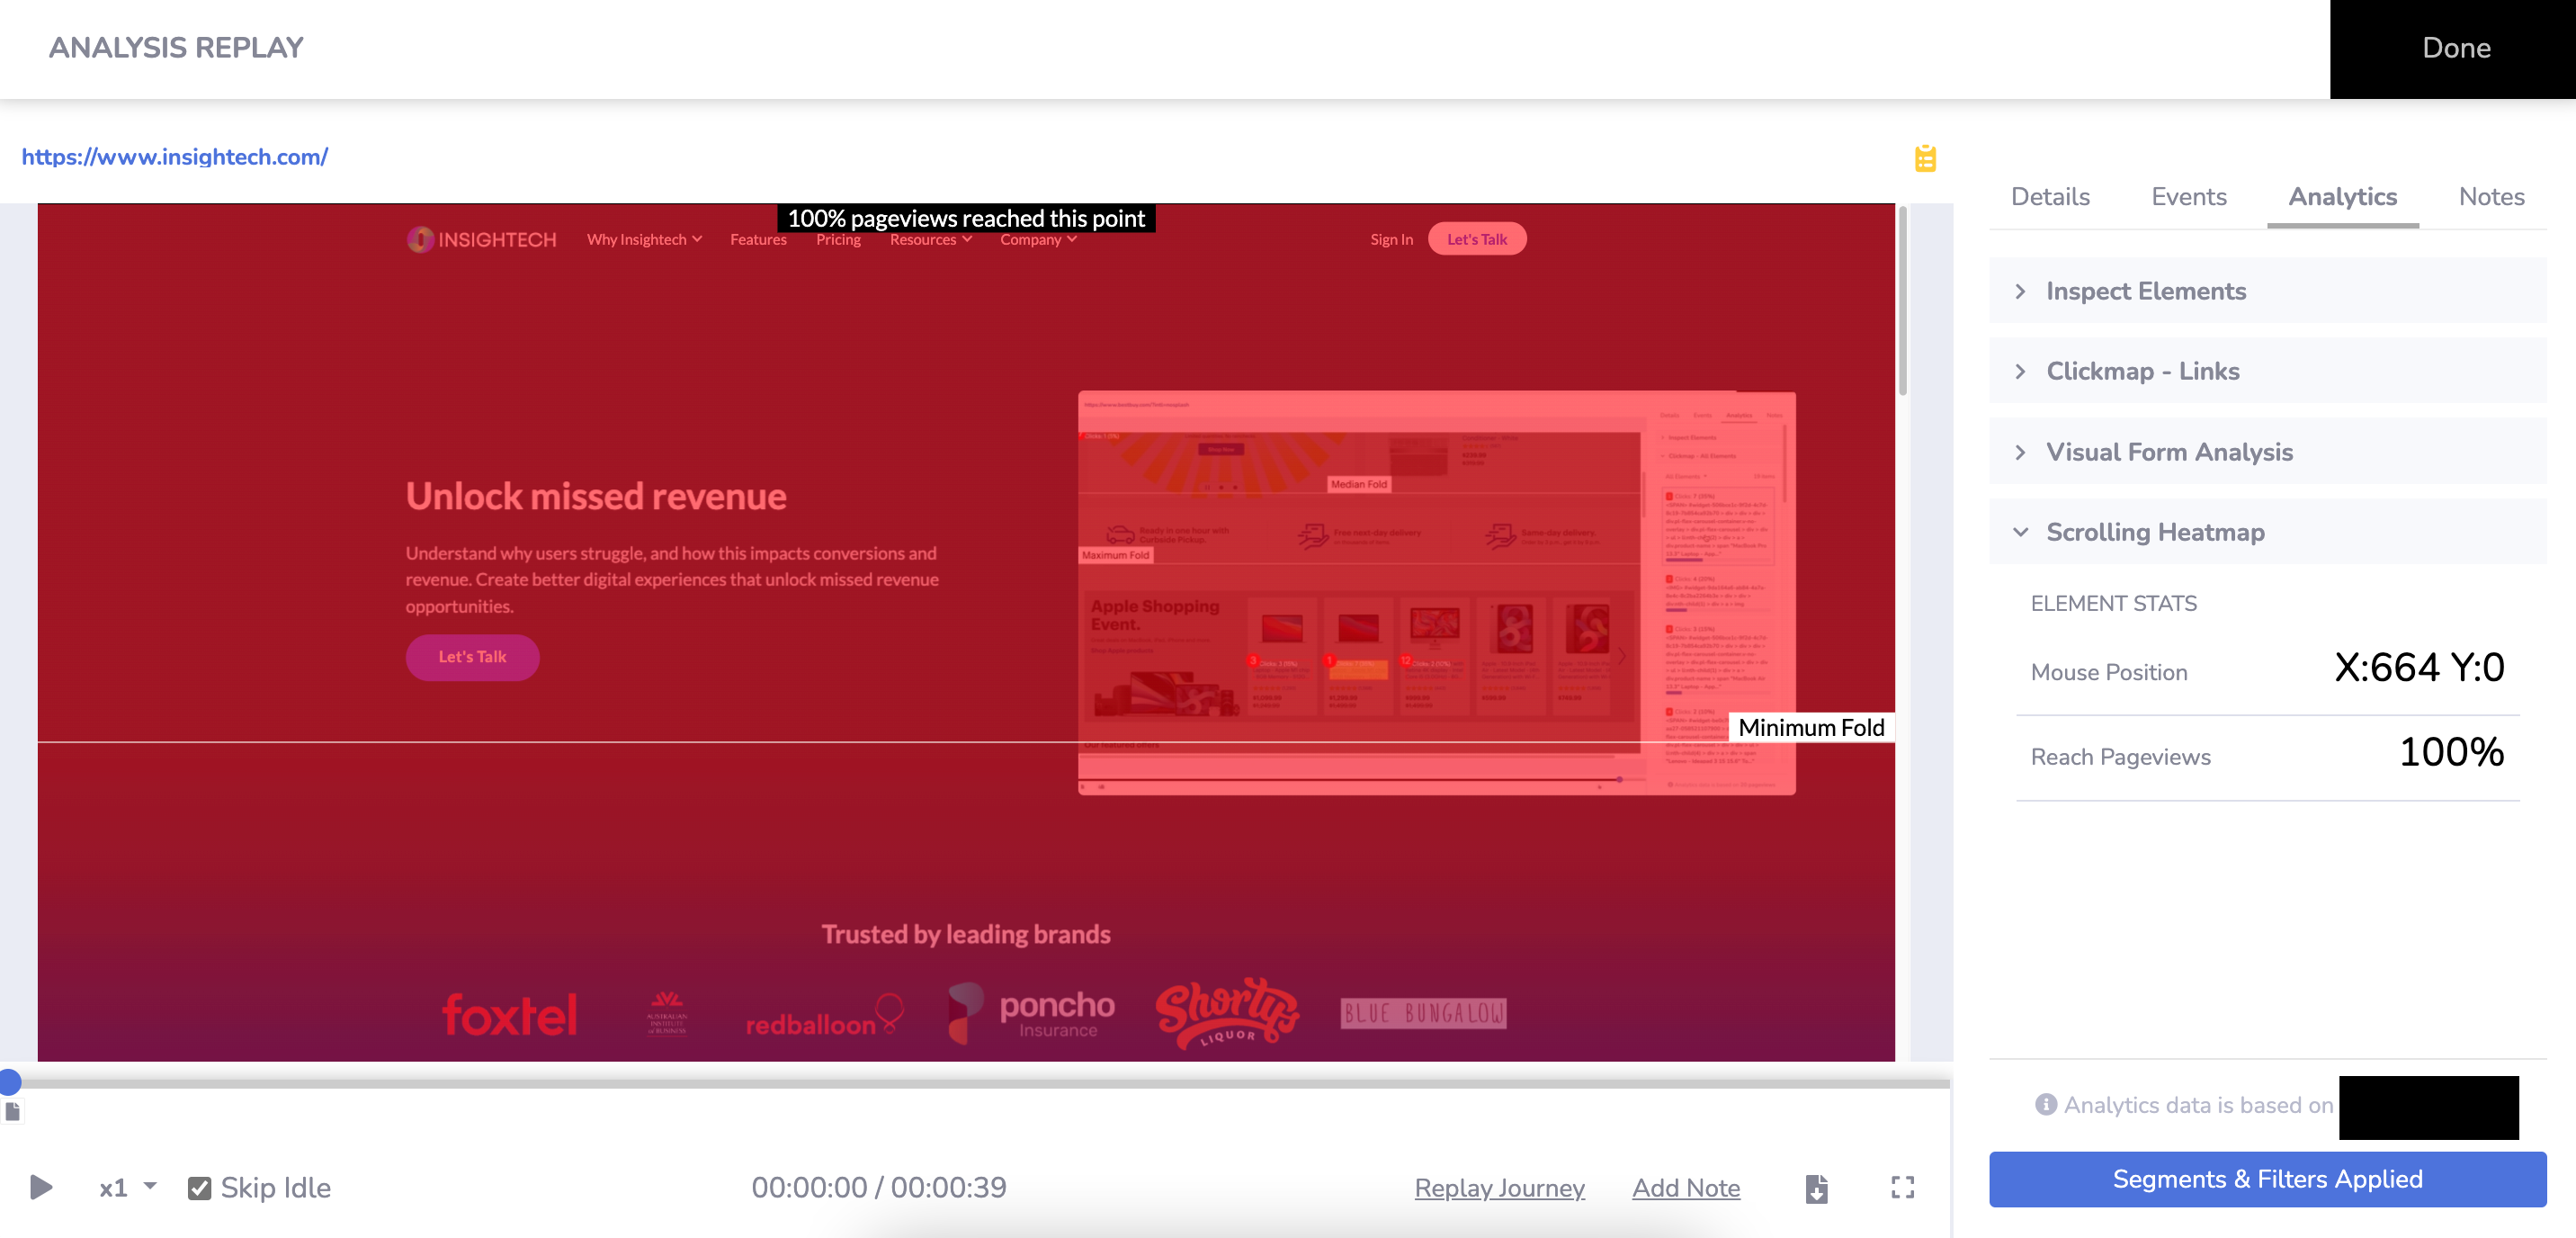
- Hover over each section that you want to analyse and write down the pixel depths for each content section into a spreadsheet (Note: Mobile and Desktop should be measured separately). Here is an example:
- Click your scrolling heatmap at one of your content sections to run a search for users who have seen your content section
- Navigate to your funnels, with your search rules applied.
- Update your spreadsheet with the number of sessions that have viewed your content, and their conversion rate
- Repeat the process for each piece of content, or simply change your filter rules for each pixel depth you want to analyse.
- Calculate the uplift in conversions as users see each new piece of content.
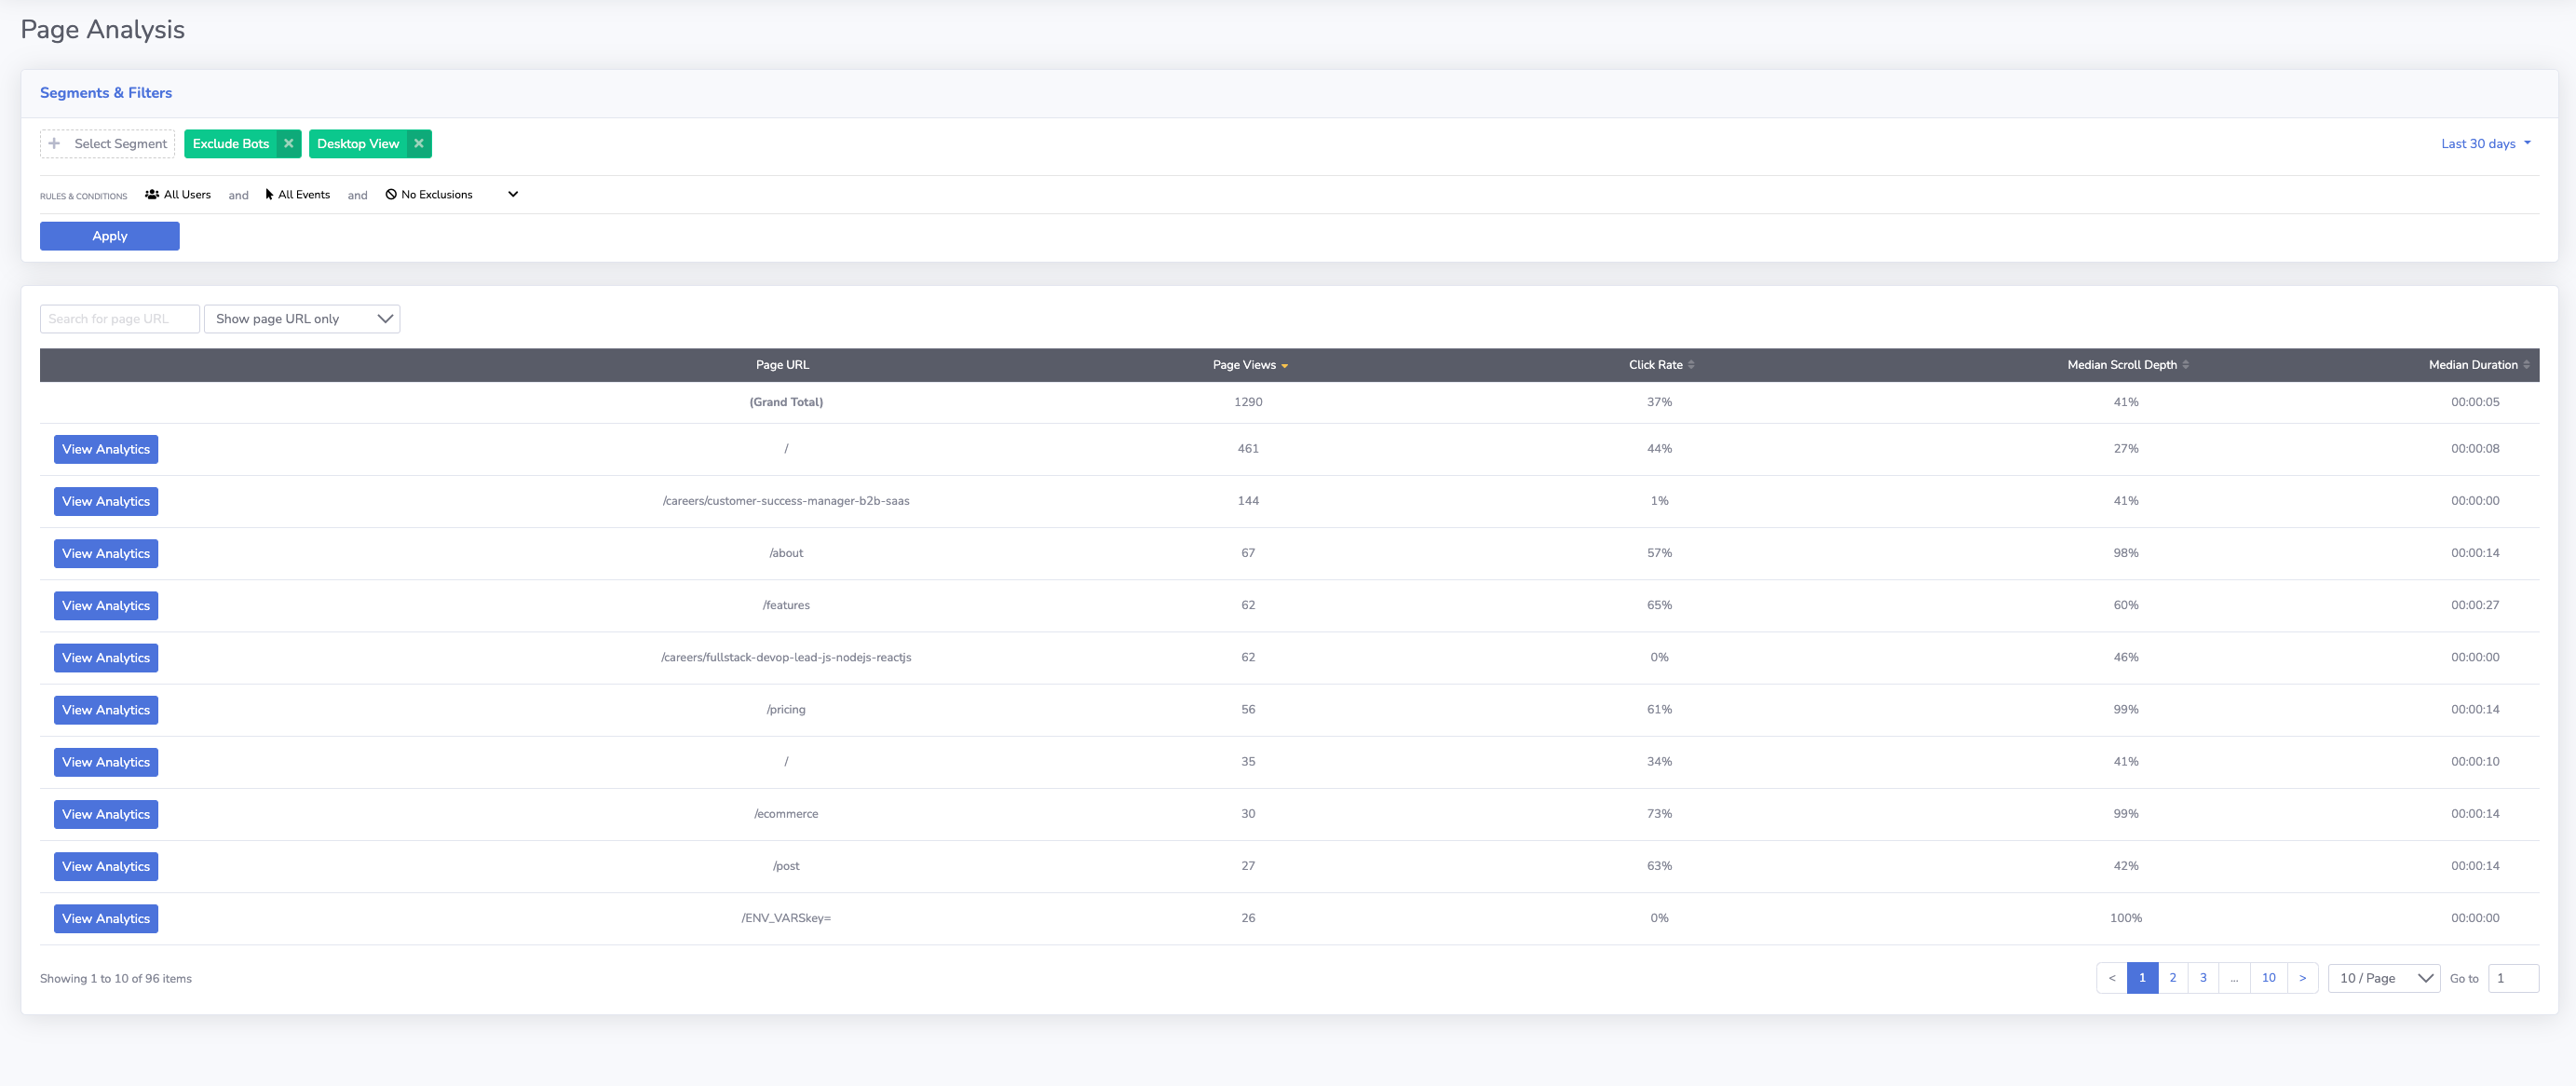
3. Comparing Key Pages & Their Engagement
Page Analysis Reports allow you to quickly compare content engagement rates across multiple pages at once. It is useful when analysing the performance of landing pages, or to simply see which pages need further investigation.
To explore any on-page engagement, simply click on the page you want to explore and analyse.
Below is a Step-By-Step Guide
- Navigate to Page Analysis in Insightech
- Select a page URL once the desired field and date filters have been applied.
- Filter for URLs that you want to compare, or see aggregate engagement metrics for.
- Click Analysis for the page you want to analyse further. This will allow you to bring up on-page click maps and scrolling heatmaps mentioned above.
When to use each approach
Situation | Approach |
When analysing page features/content that users click and interact with | 1. Analysing which content clicks drive revenue. This will allow you to quickly compare which page features drive more growth for your business, and which ones have more opportunity for improvement. |
Page re-designs, or when measuring content effectiveness | 2. Measure Impacts of Content Seen This will allow you to quickly compare which page features drive more growth for your business, and which ones have more opportunity for improvement. |
When analysing landing pages, comparing pages, or needing engagement metrics for groups of pages | 3. Comparing key pages & their engagement Compare engagement across key pages, along with an aggregate metric |