What Is A Funnel?
A funnel is a visual way to measure how far users progress through key customer journeys and flows on your website and where they are most commonly abandoning those paths.
You can also use any event or behaviour from your website to set up funnels, meaning you can measure the fine details around if your website is loading, or responding when users engage with a feature.
Insightech funnels are also interactive meaning that you can click any funnel step, or abandonment step to investigate that audience. This allows you to navigate to other reports like The Dashboard, Pathing Report, or watching session replays for these users to understand what is happening in your customer journeys.
Accessing Your Funnels
Click Funnels in the left‑hand navigation to open up the lists of funnels. If funnels are organised into folders, you’ll see a row of folder names at the top; click a folder to view its funnels.
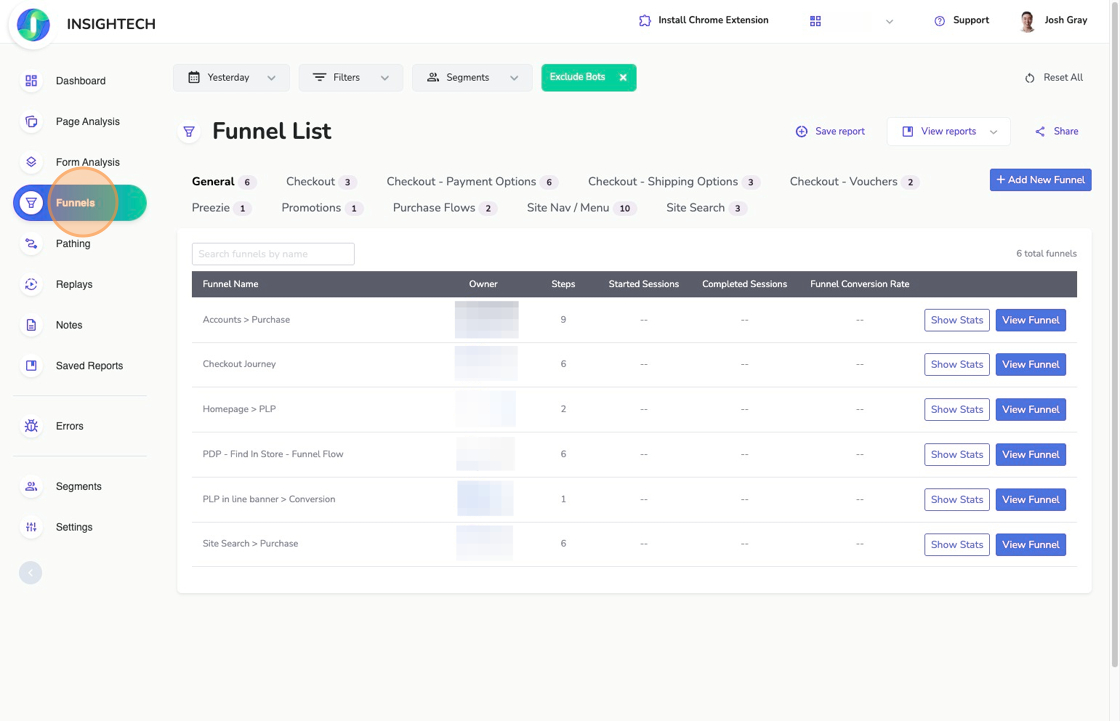
There are two actions on this page:
- Show Stats – expands the row to reveal the numerical values for Started Sessions, Completed Sessions and Conversion Rate for the selected date range.
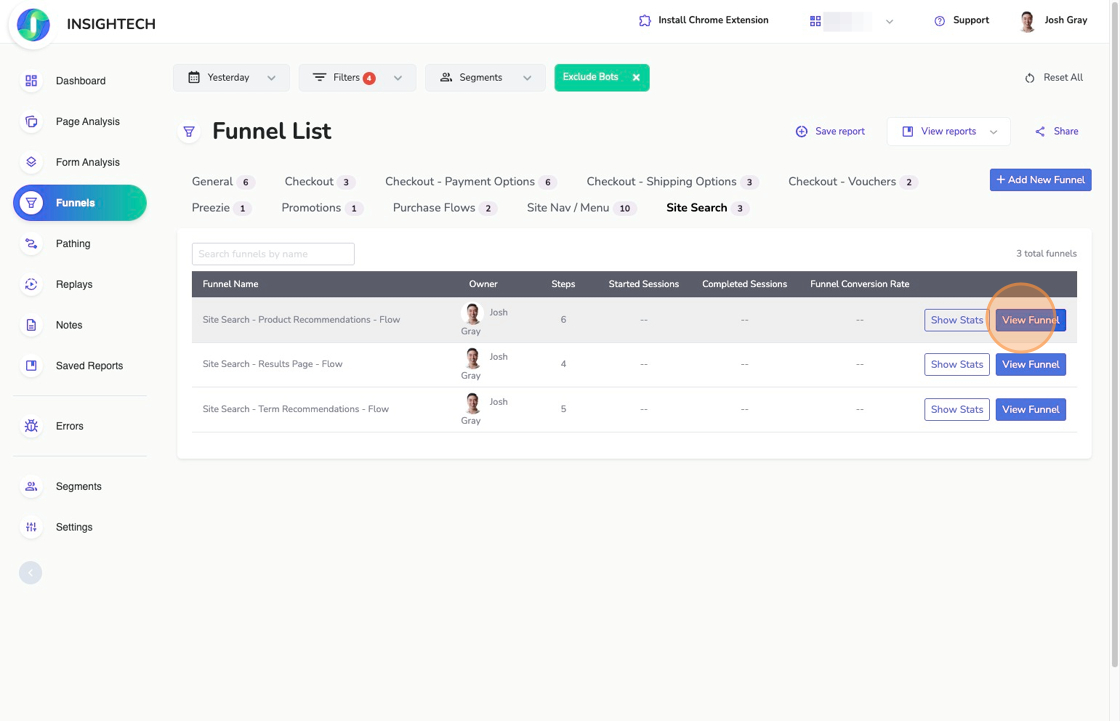
- View Funnel – opens the Funnel View page to analyze the steps in detail.
Use the date range picker, Filters, Segments menus, Exclude Bots toggle and Reset All button at the top to refine the data being shown. Click Add New Funnel to create a new funnel; for instructions on building funnels, see our Set Up Your Funnel guide. The Funnel List also includes Save report and View reports buttons to store or reopen funnel views, and a Share icon.
Viewing a Single Funnel
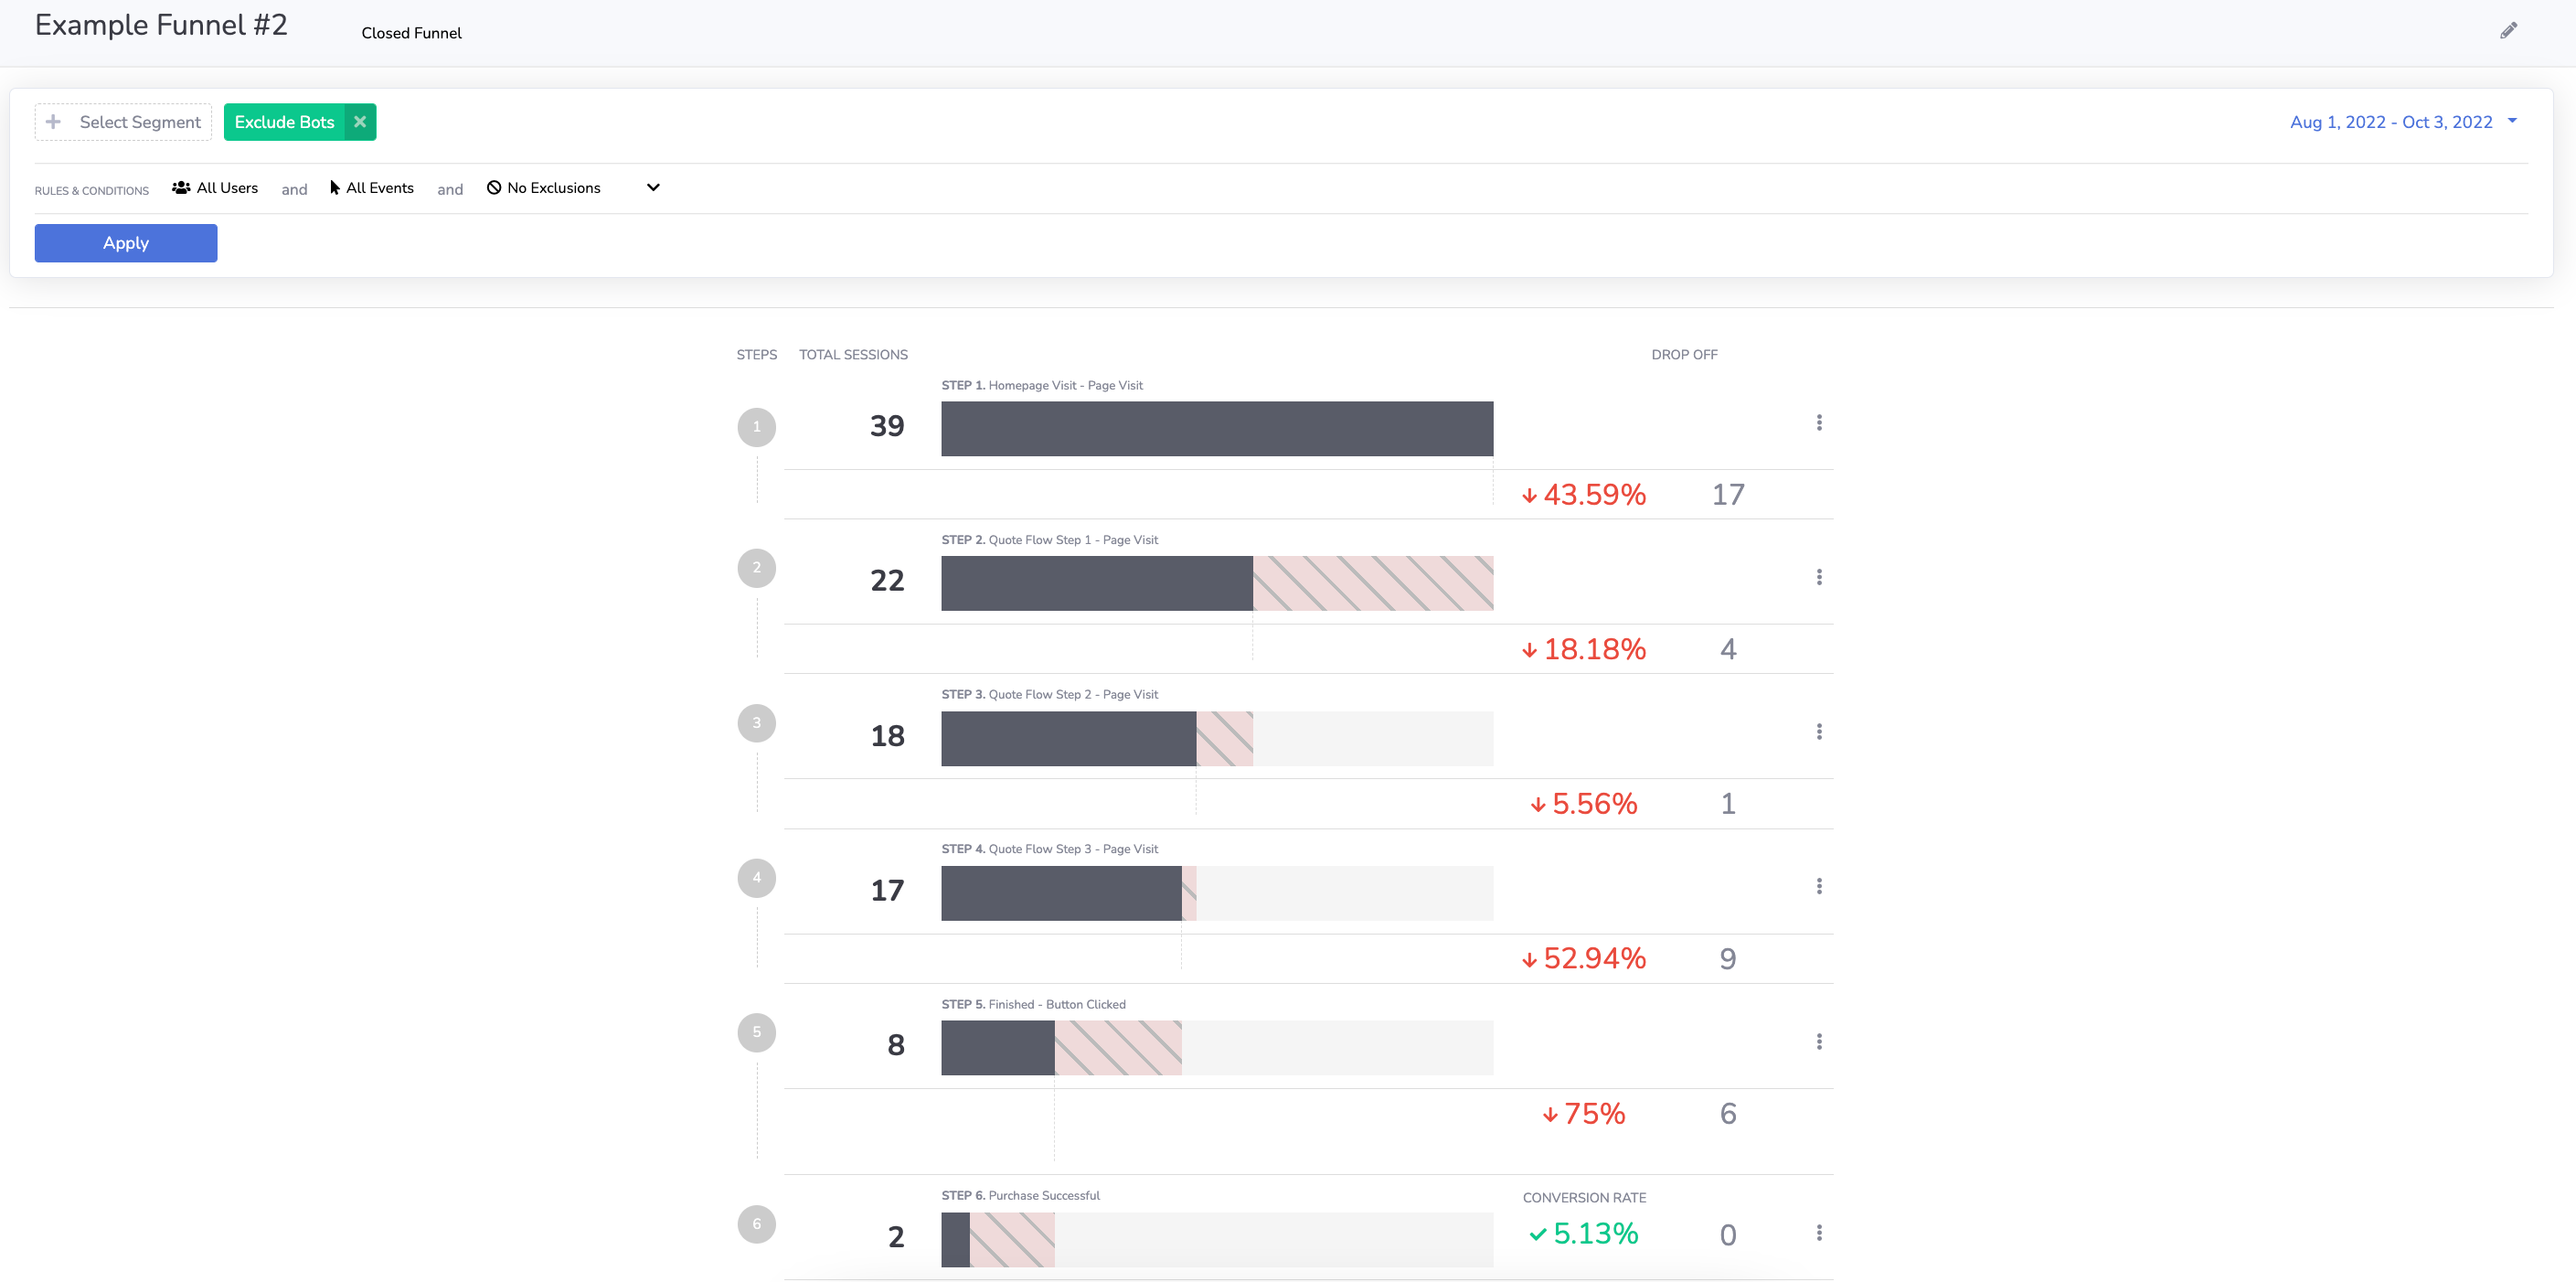
From the Funnel List page, you can click View Funnel to open up a single funnel and see how users are flowing through each steps, and where they are abandoning.
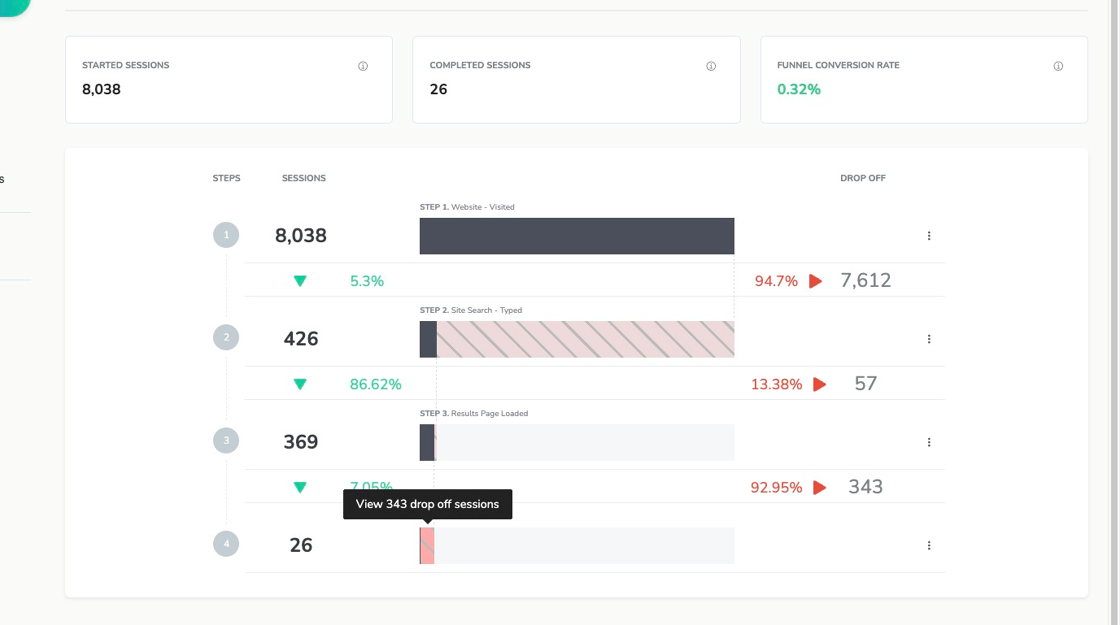
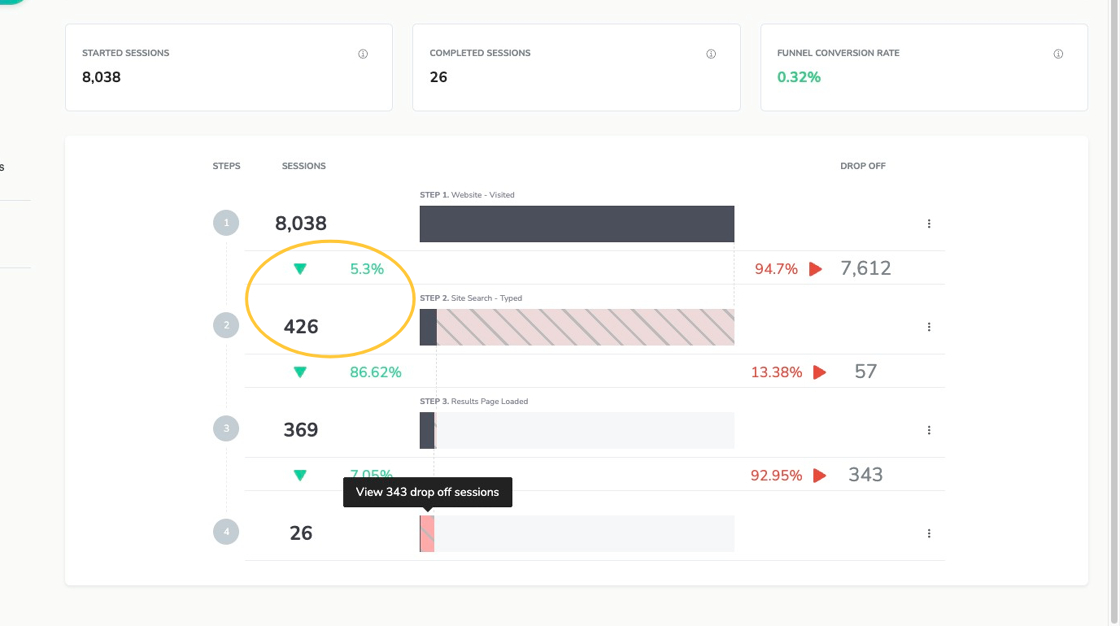
Once opened, your funnel will show you key stats about your funnel flow including how many started the funnel, finished, and the completion rate. You will also see how many sessions reached each subsequent step, and how many abandoned (shown on the right).
For more detailed guidance on building and editing funnels, including step configuration and order, see Set Up Your Funnel. To dive into the journeys within a step, use View Sessions and read our Session Replays article for analysis tips.
Understanding Your Funnel
Step Conversion Rates
Your funnel will show the rate that each subsequent step has happened. In this example, we can see that 5.3% of sessions that started this funnel reach the second step, for a total of 426 sessions reaching step 2.
Funnel Abandonment
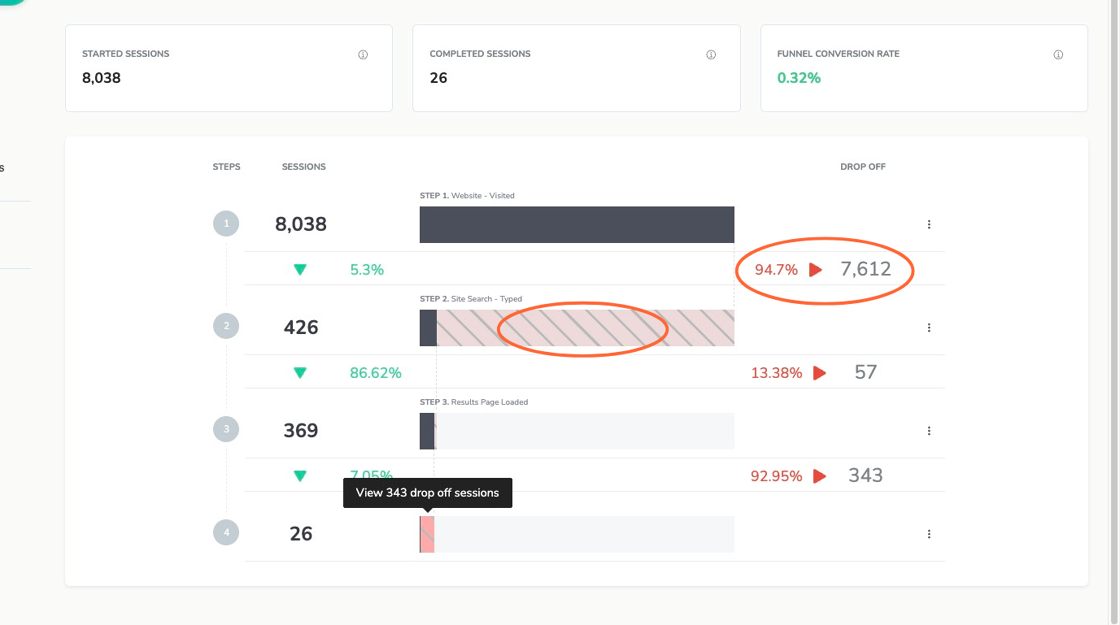
We can also see how many sessions did not reach each step in our funnel (i.e. Abandonment). Using the same example as above, we can also see that 94.7% of sessions (a total of 7,612 sessions) did not reach step 2.
Investigating Abandoning Users
To investigate any sessions that reached a step, or any sessions that abandoned before reaching a step (red bars), we can click the actual funnel steps (black bars) / abandonment steps (red bars) to filter for the users that fell into that group.
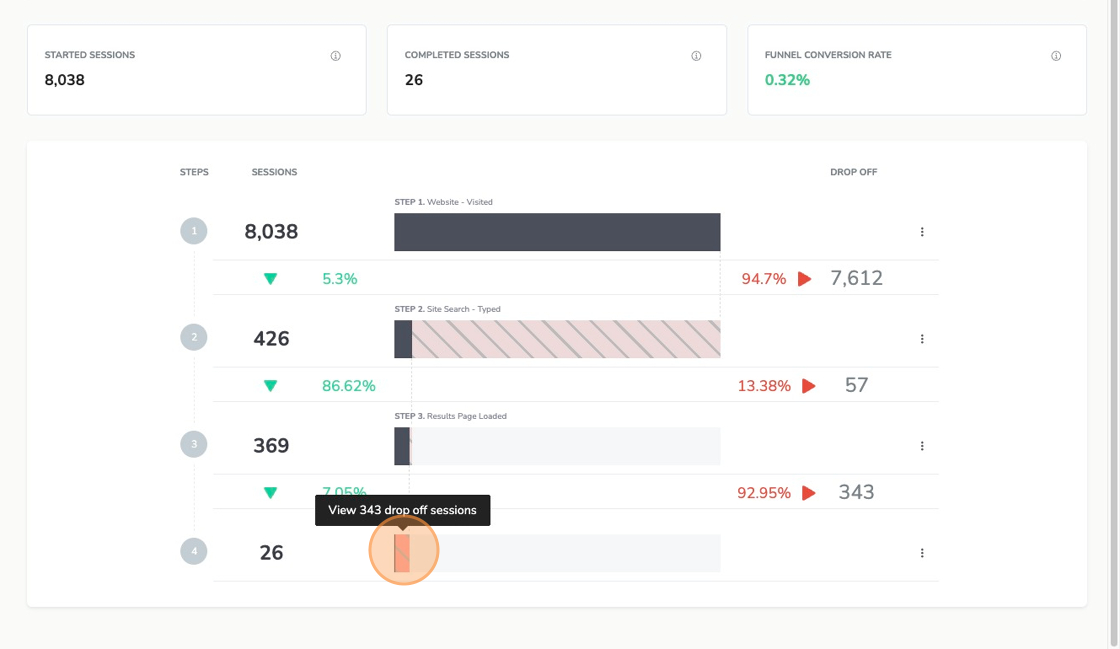
If the funnel bars are too small, you can click the ellipsis (3 dots) to the right of the steps you want to click on. This will give you two options, to select the sessions that reached that step, or the sessions that dropped off / abandoned before reaching it.
Once you have selected these users, you can then navigate to other reports like The Dashboard, Pathing Report, or watching session replays for these users to understand what is happening in your customer journeys.
Funnel folders
Funnels can be grouped into folders to make it easier for you to find/share funnels with your team.
Use the Folder dropdown when creating or editing a funnel to assign it to a folder or create a new one. You can switch between folders by clicking their names at the top of the Funnel List.
Click to read our Funnel Folders article for more information.
Common Funnels You Might Want To Set Up
You will want to measure key website flows to look for abandonment, and also key features on your website (making sure they are working correctly).
Website Conversion Flow This should be your main conversion paths / flows, measuring the essential steps required to complete a conversion for a first time visitor. This funnel will shows how easily / likely users navigate to each subsequent step in your funnel. High abandonment points should be investigated for customer indecision or friction / issues occurring at that point in the customer journey |
Login Flow Measure the rate that users start the login process on your website, and how often this process fails. |
Site Search Performance Measure the rate that users start interacting and typing into your site search. Out of these users, you might also want to know if product recommendations are successfully loading for everyone, and how many users click these. Comparing the performance of search results pages to product recommendation links will also help you optimise these. |
Key Features Simply measuring how often users interact with the feature, whether that feature responds/loads as intended, and the conversion rate from there, will tell you if this feature works as intended, and whether you need to amplify / fix this feature. |
Sales Categories - Conversion Flows Copying your website conversion flows, and breaking them down by product categories will help you dive into specific product related friction through your customer journeys. |